In the summer of 2024, I interned at Intuit Mountain View Office as a product designer on the Mid-Market (QuickBooks Advanced) team. I worked on Intuit Enterprise Suite, a configurable suite of integrated financial products designed to seamlessly scale and enhance productivity and profitability for businesses as they grow. I included two projects on this page that I contributed to the Intuit Enterprise Suite team. They showcase shared platform capabilities.
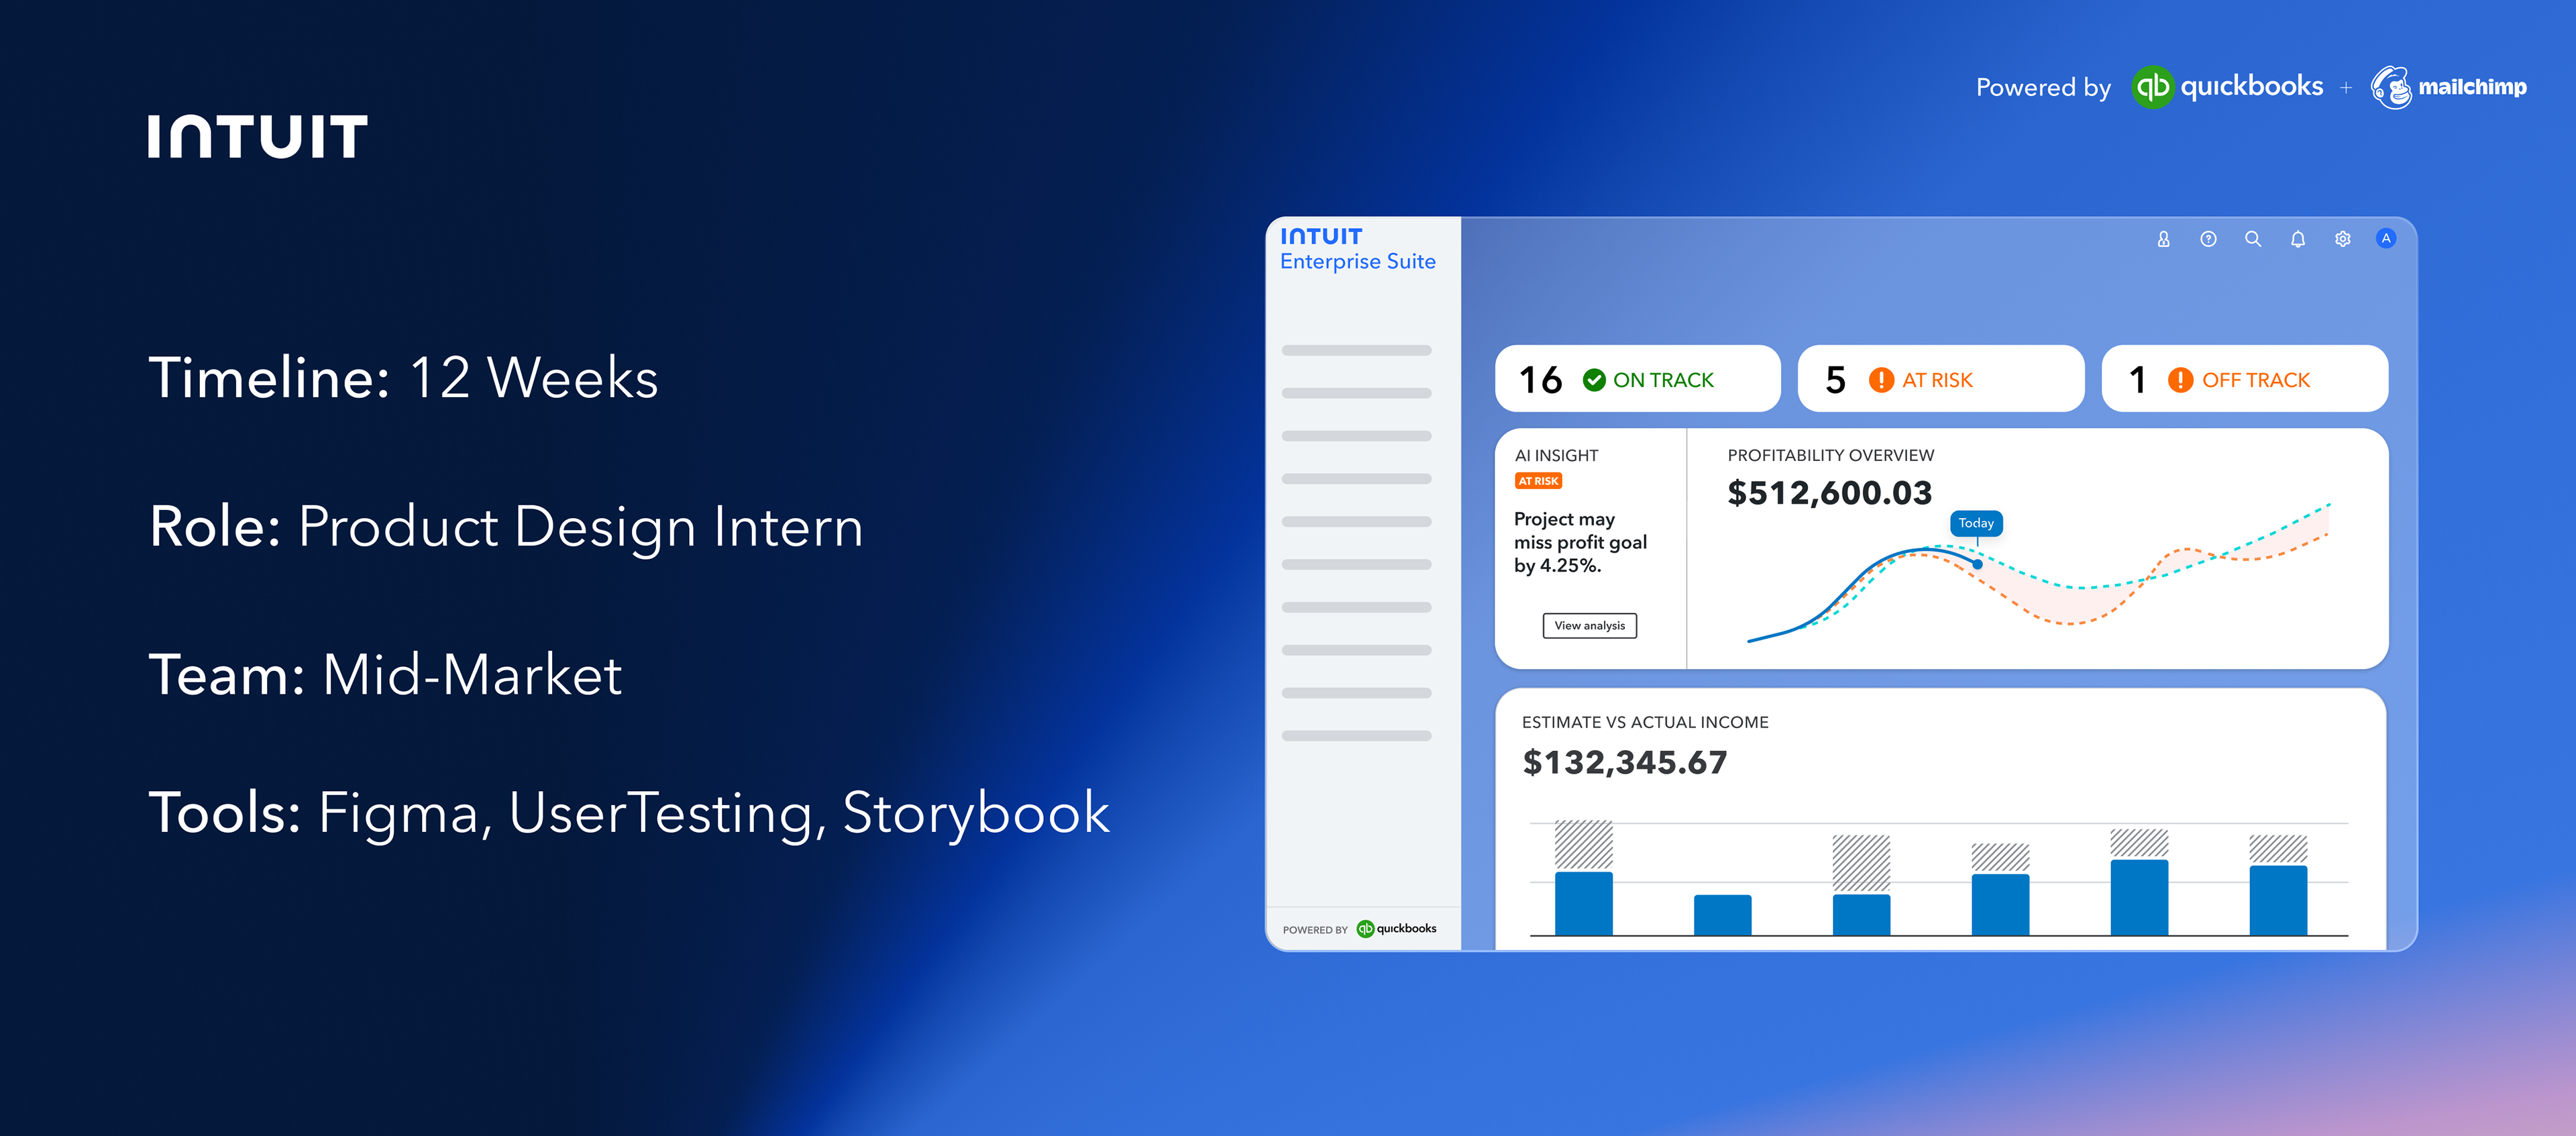
Role: Product Design Intern
Team: QuickBooks Mid-Market
Time: 6.11.2024-8.30.2024
Involvement: Project Profitability, Intuit Enterprise Suite(IES) Scalability, Insight Widget Capability
Tools: Figma, UserTesting, Storybook, Coda
My contributions:
1. Project Profitability: designed different states (edit, remove, delete) for the profit margin goal editor, iterated on the insight widget card based on Mid-Market customer feedback collected via UserTesting, and designed the feedback loop for root cause analysis.
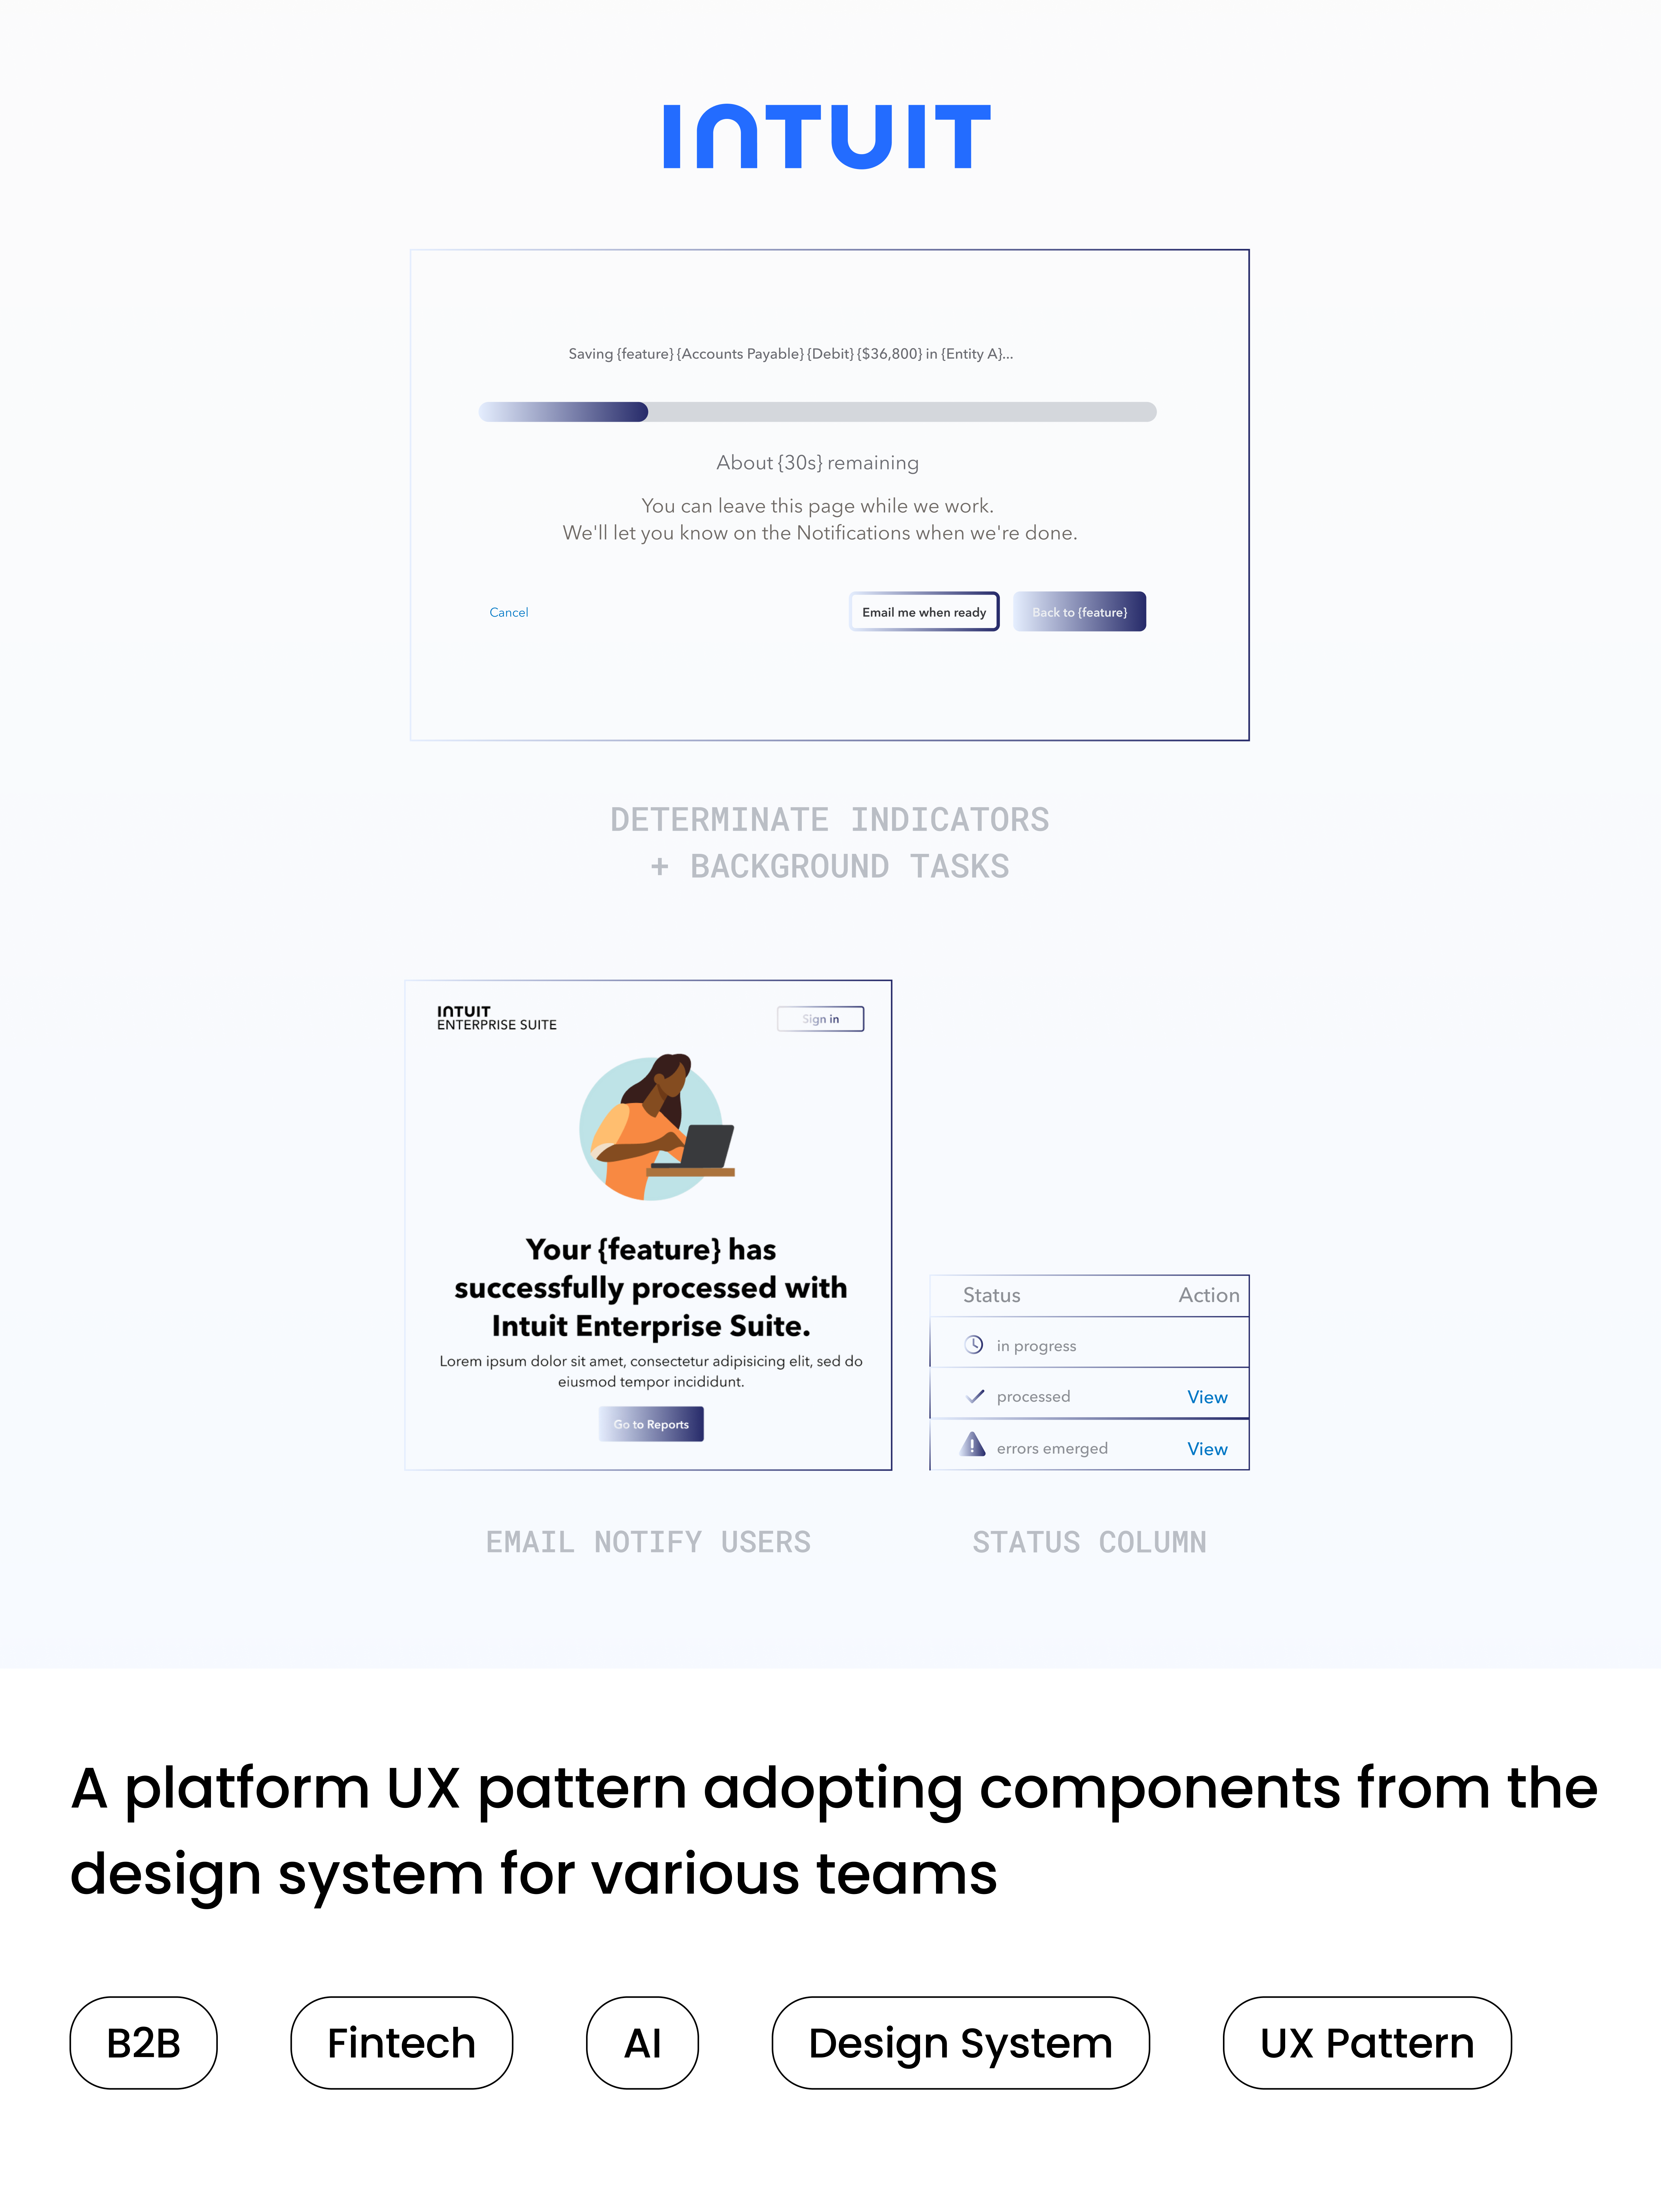
2. IES Scalability: Established a platform capability by adopting components from the design system for various teams, including Verticalization, Projects, and FP&A, and scaled this solution to be reusable across different use cases and touchpoints. (View in another page)
01. Mid-Market AI: Project profitability
How did I help Mid-Market customers track project profitability and boost the engagement rate by 60% within 12 weeks?
Intuit Enterprise Suite was launched on Sep 17, 2024.
Overview
At Intuit, we leverage AI to provide real-time financial tracking solution with actionable insights, making it effortless for customers to understand their projects and business finances. This helps project-based businesses stay on time and within budget.
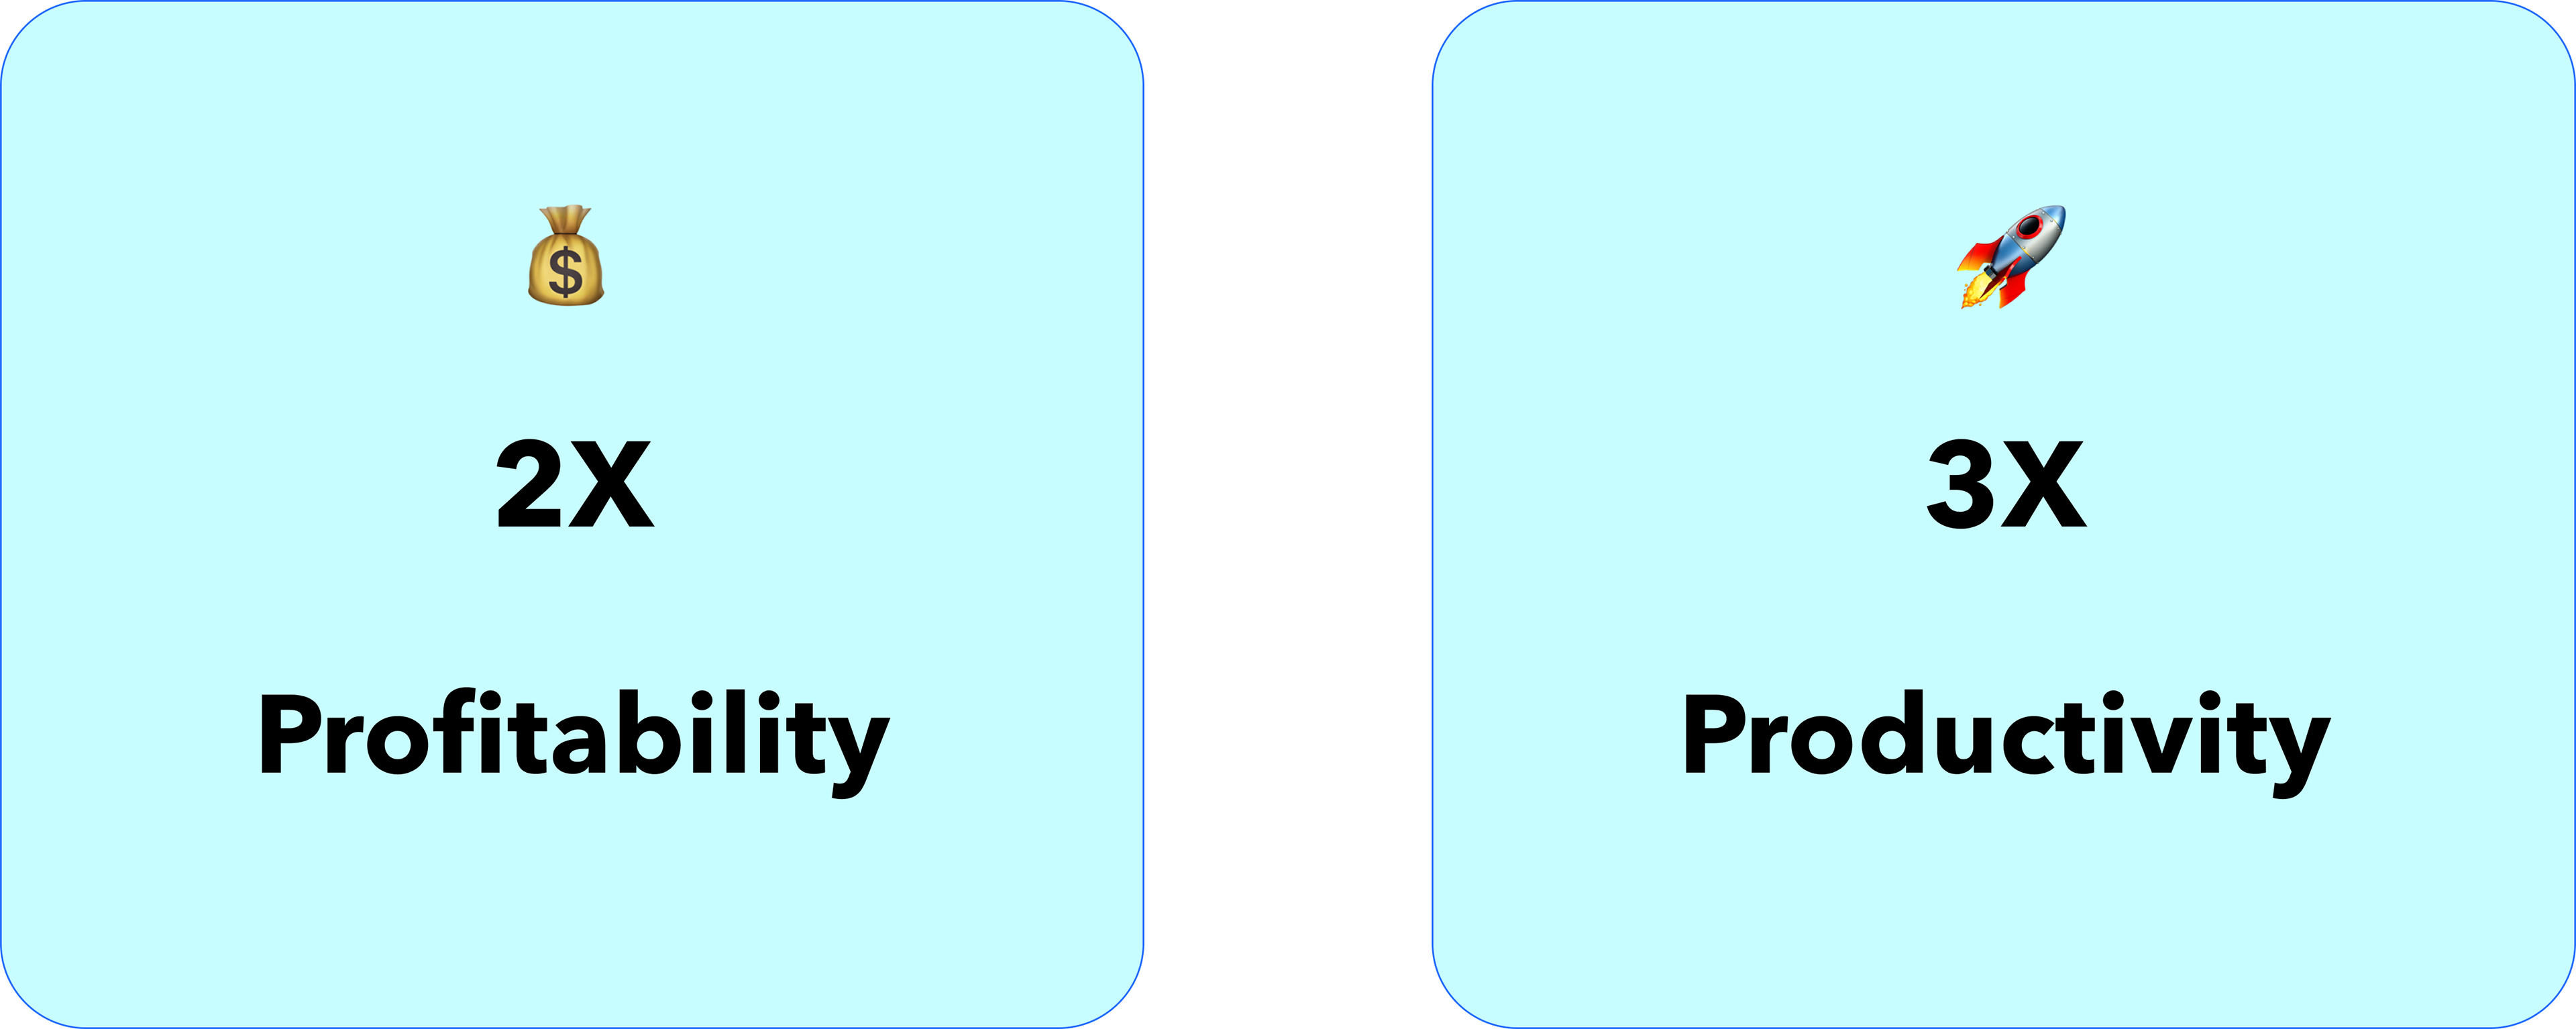
Business Goal
We're solving for construction with profitability and productivity, tailoring more solutions to achieve
Research
Meet the Customers: Mid-Market businesses
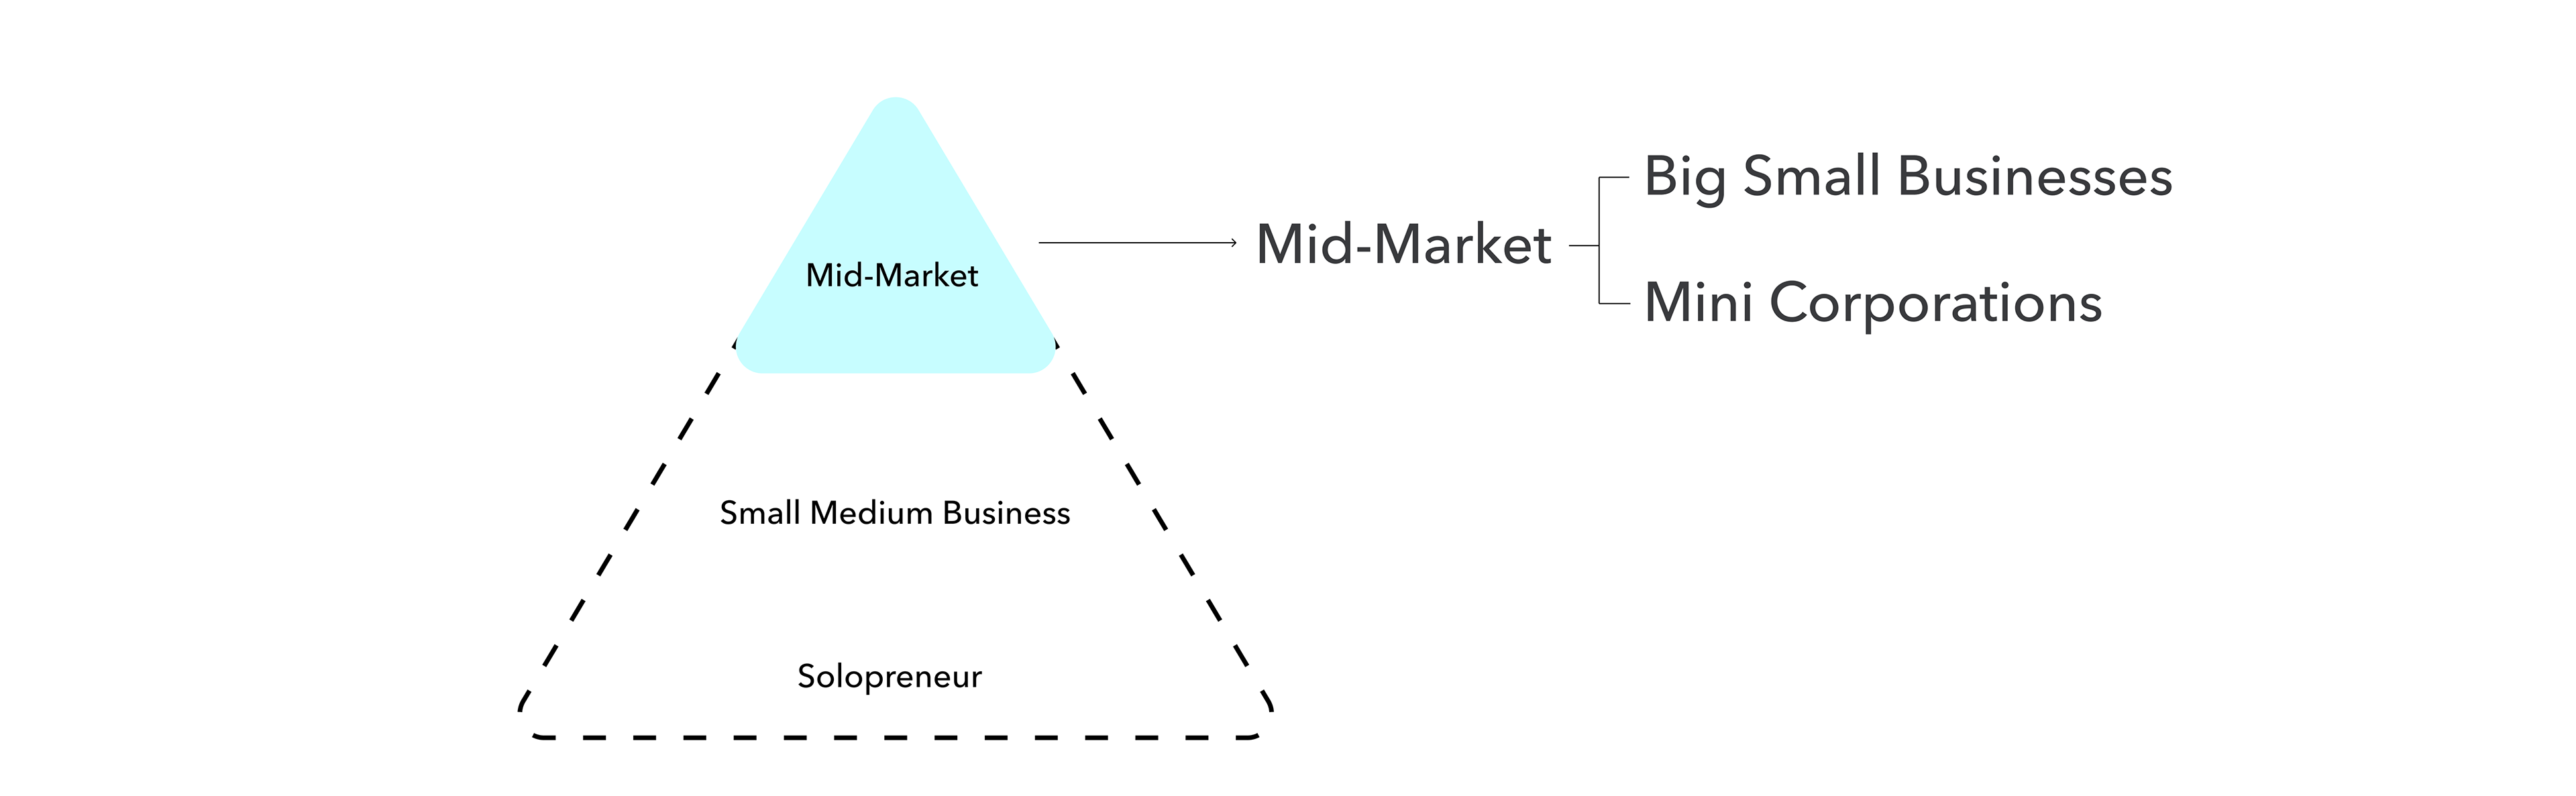
Intuit is best positioned to serve the $89 billion total addressable market of larger, Mid-Market businesses(consisting of Big Small Businesses, and Mini Corporations) with more complex business needs as they scale.
Customer Problem
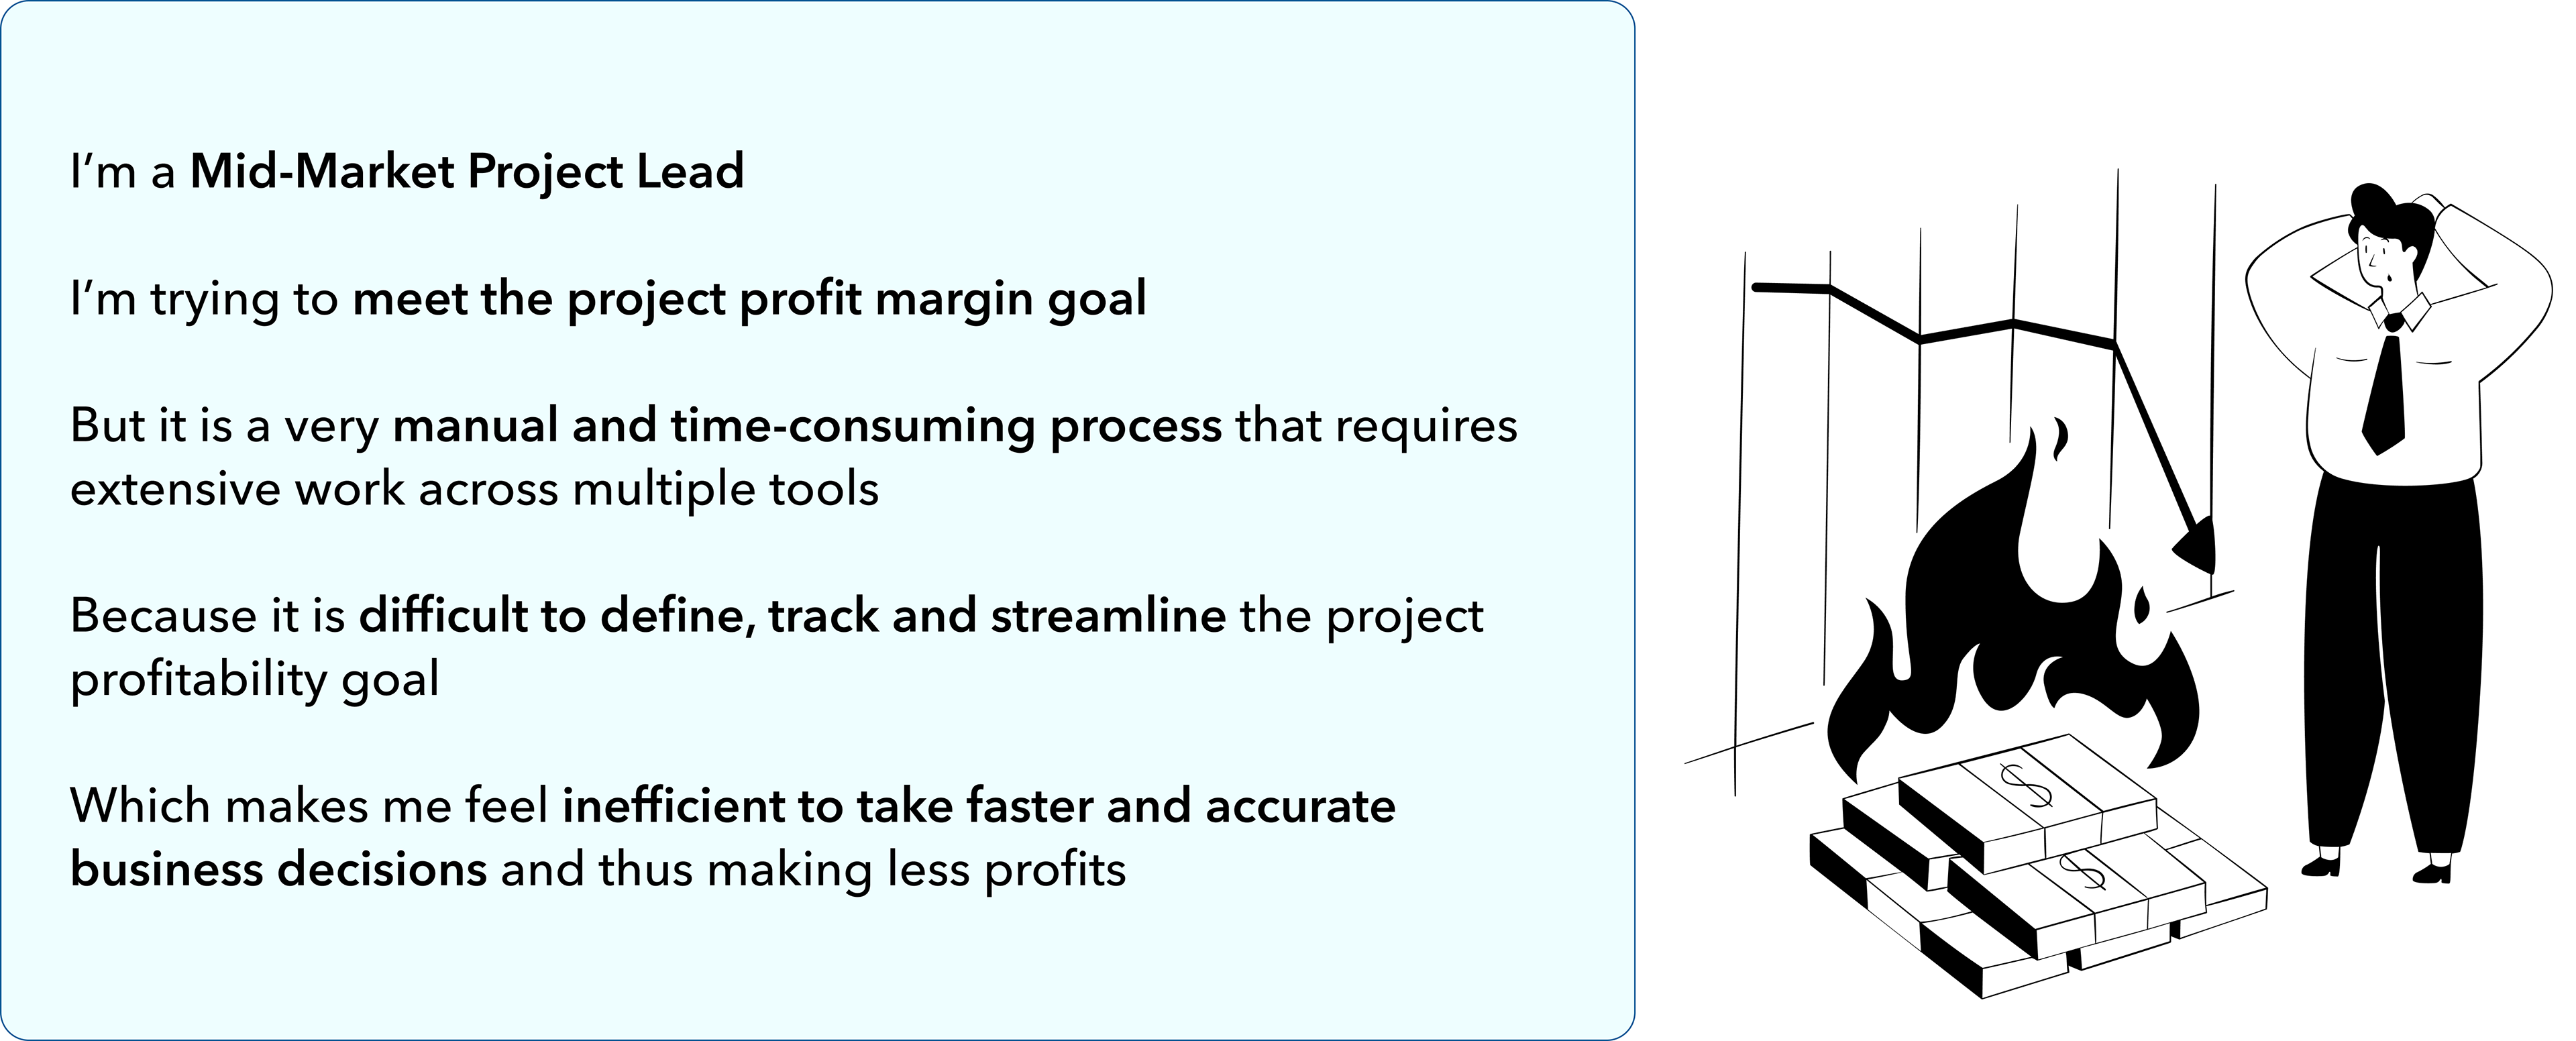
Reframe the Problem
Based on the voices of Mid-Market customers and customer problems, I summarized the high-level key insights from our customers:

How Might We...
How might we simplify the process of setting project goals and tracking profitability to help Mid-Market users stay aligned with financial targets and outcomes?
Proposed Solution
This is an AI-powered project profit margin goal tracking and root cause analysis tool; Ultimately, it provides customers with actionable task recommendations.
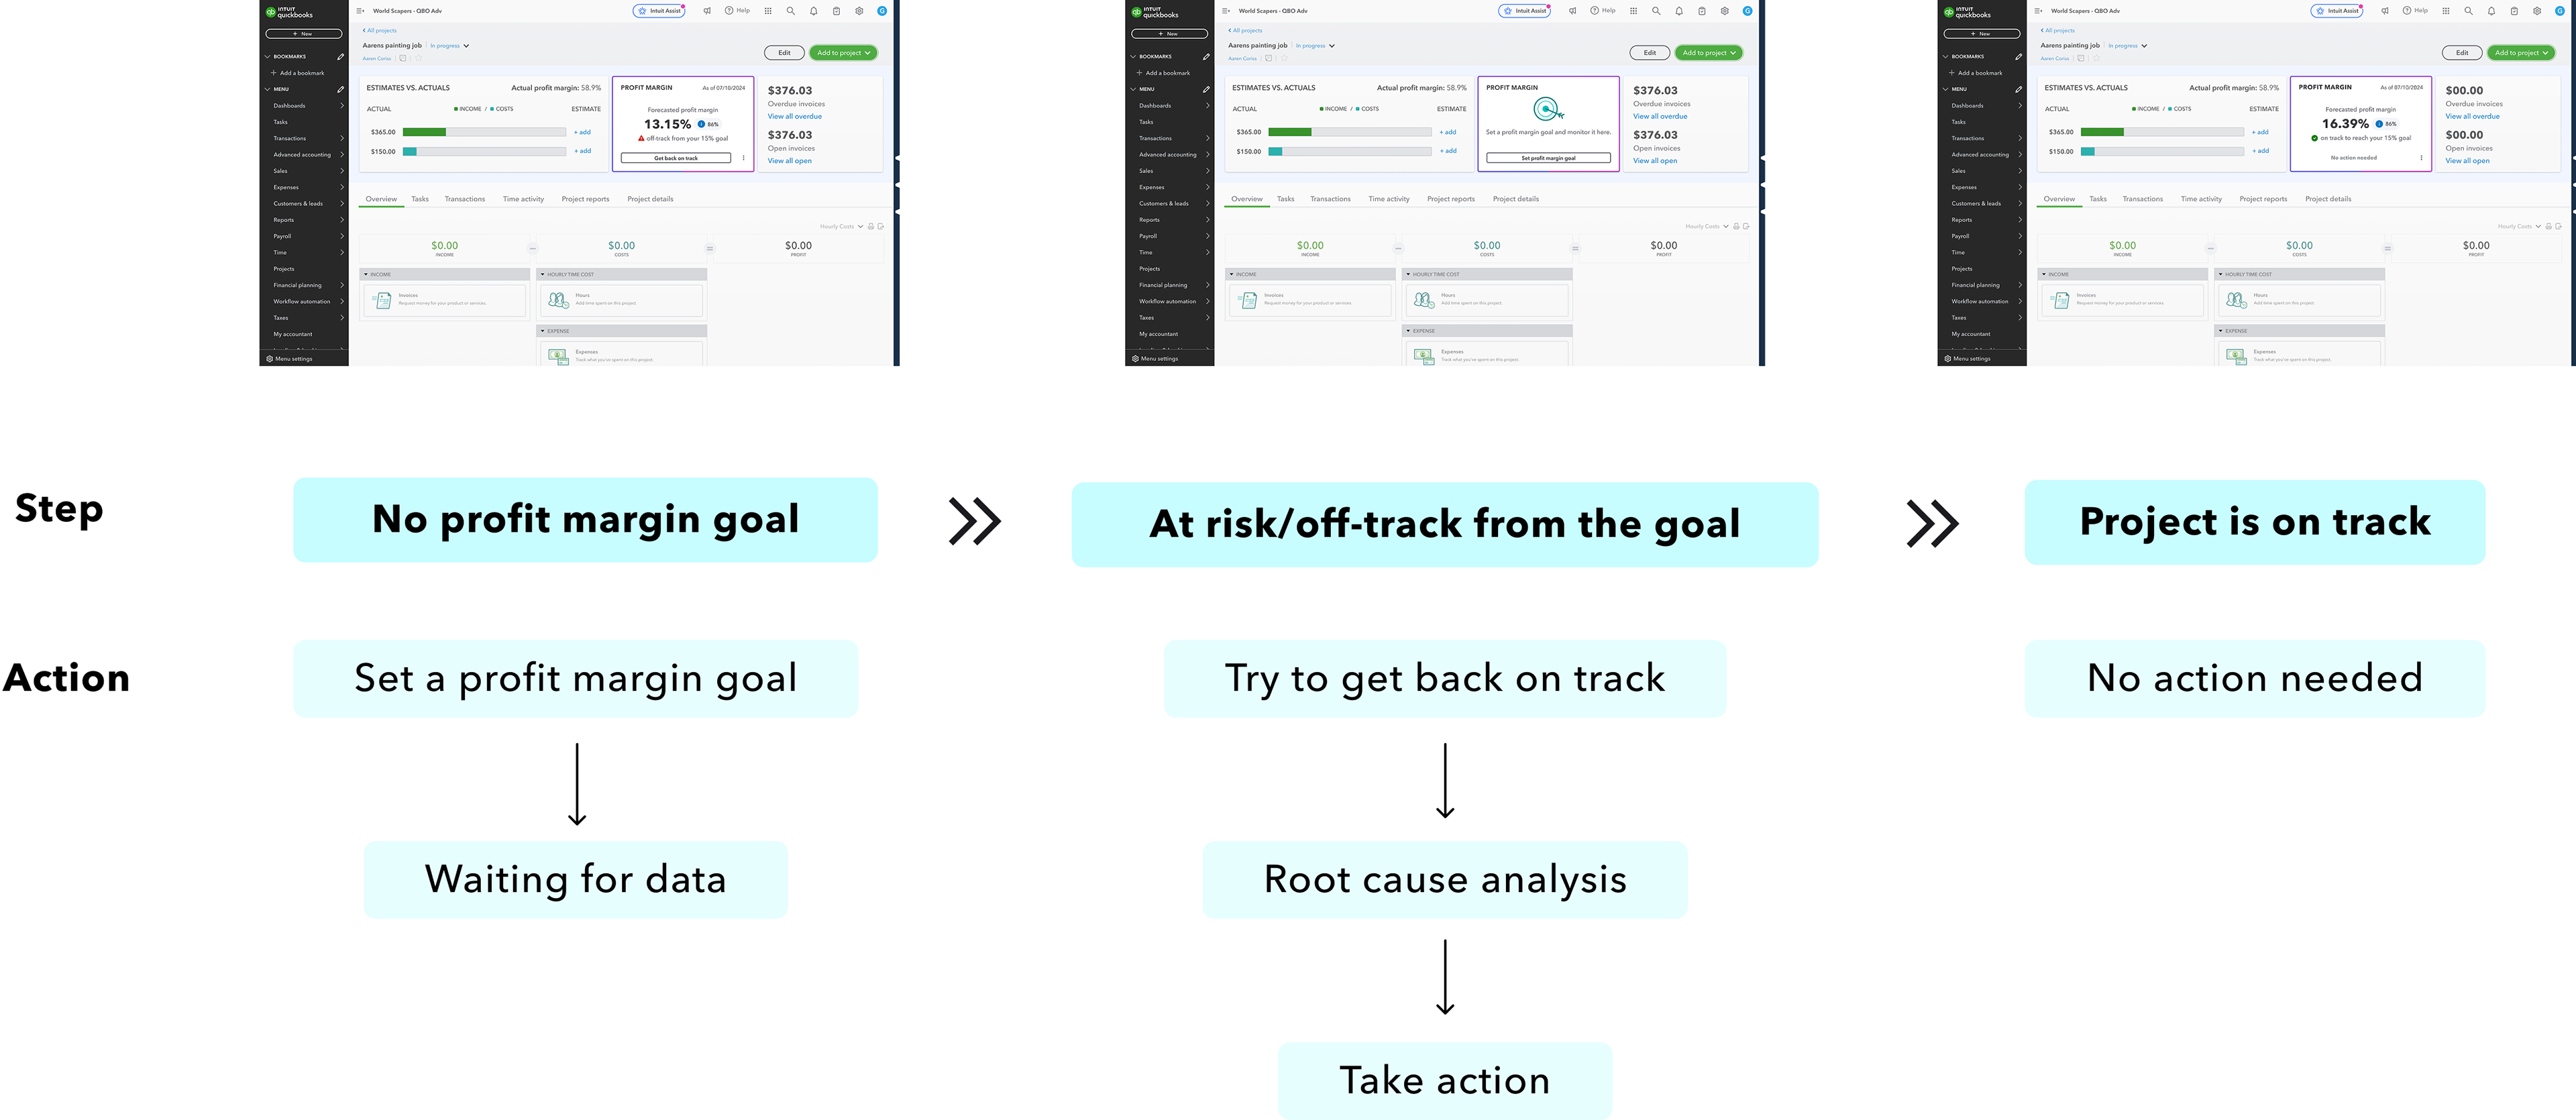
User Flow
Prototype (First version)
I Step 1
💡 Set the project profitability goal
I designed a "goal-setting card" on the "Create your project " drawer to nudge customers to set the AI-suggested profit margin goal. The card has a gradient border and a green section, designed to attract customers' attention. Moreover, setting this goal is just a one-click gesture, much easier than the previous manual process.
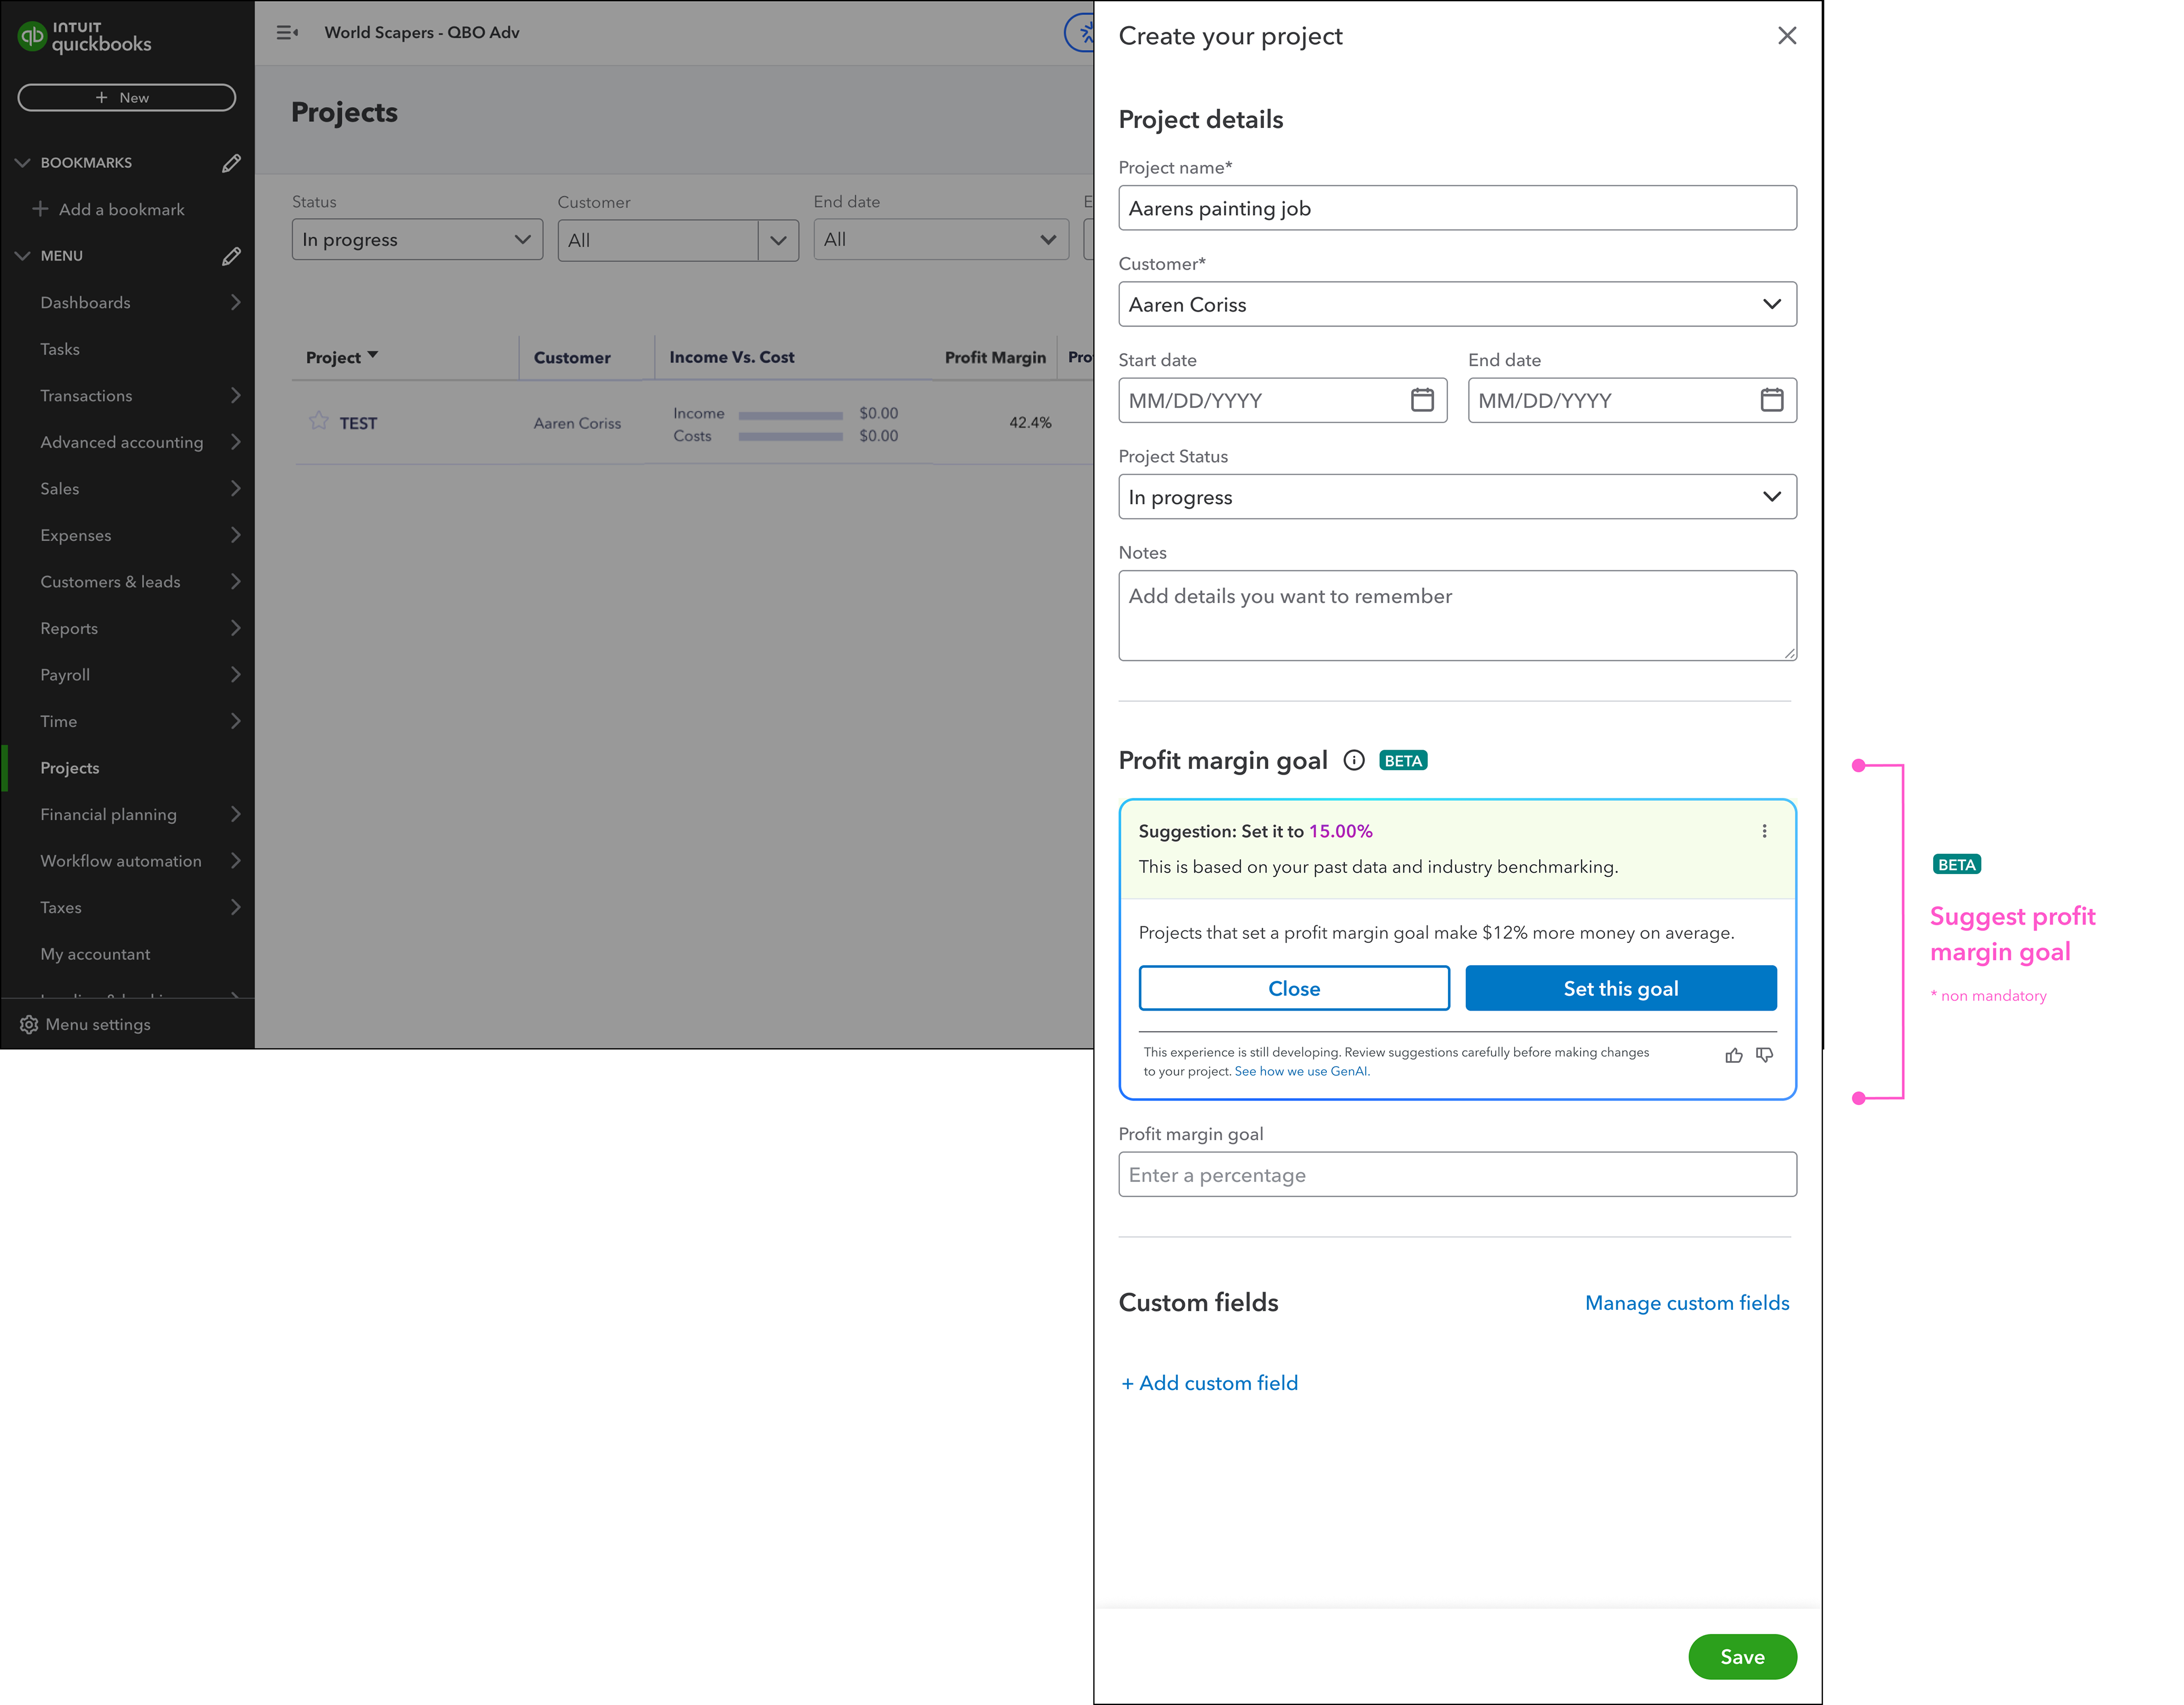
Design details
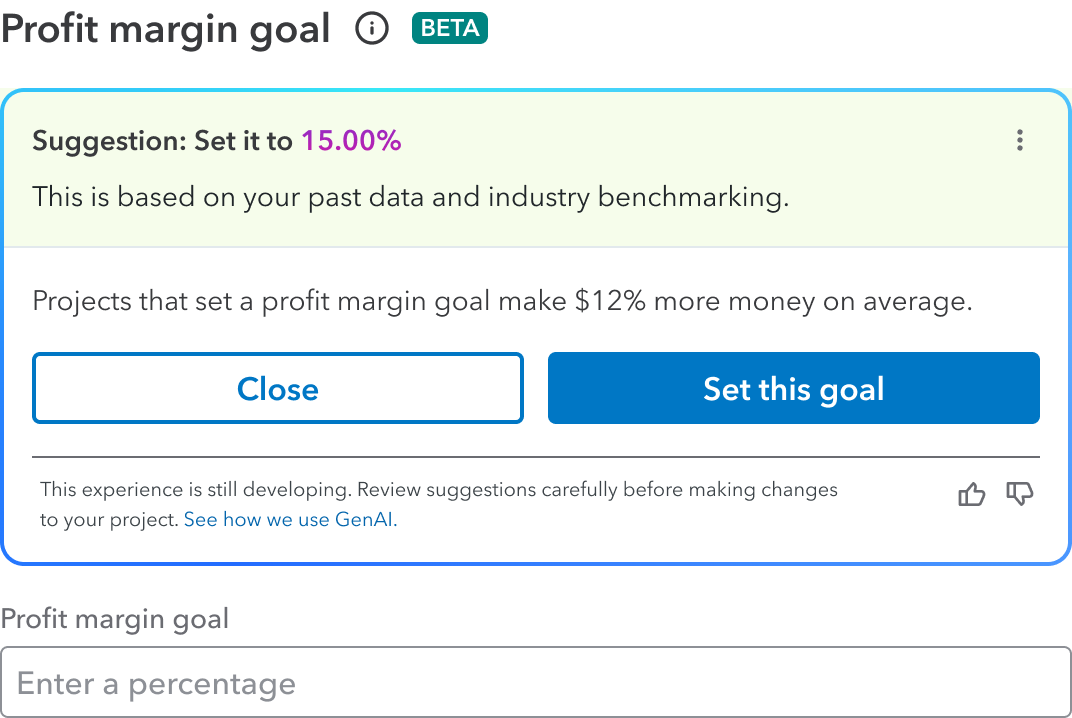
The AI-recommended profit margin goal in the prototype was 15%. However, customers could edit, remove, and delete this goal.
Edit goal

Customers can edit the profit margin goal from 15% to 14%. I created different states using the Intuit design system.
Remove goal
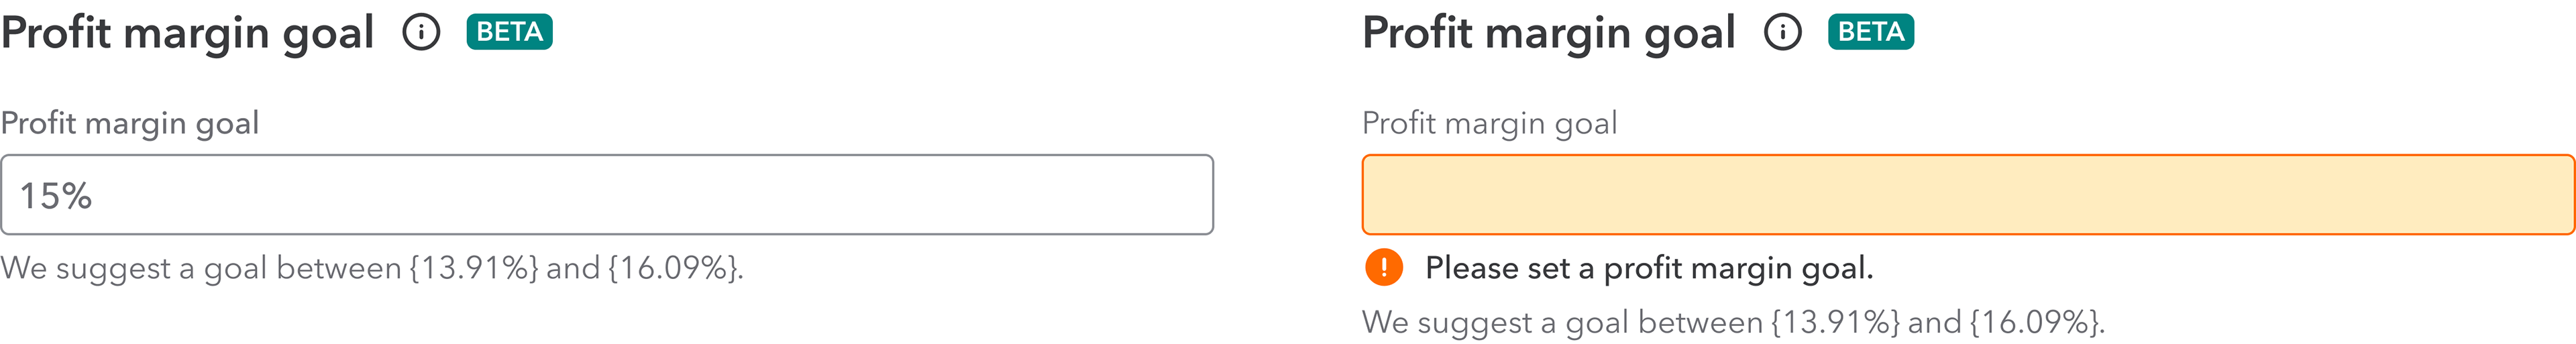
When the goal is removed, a warning message appears below the input field stating, "Please set a profit margin goal. We suggest a goal between {13.91%} and {16.09}". This ensures customers set an appropriate project profit margin goal.
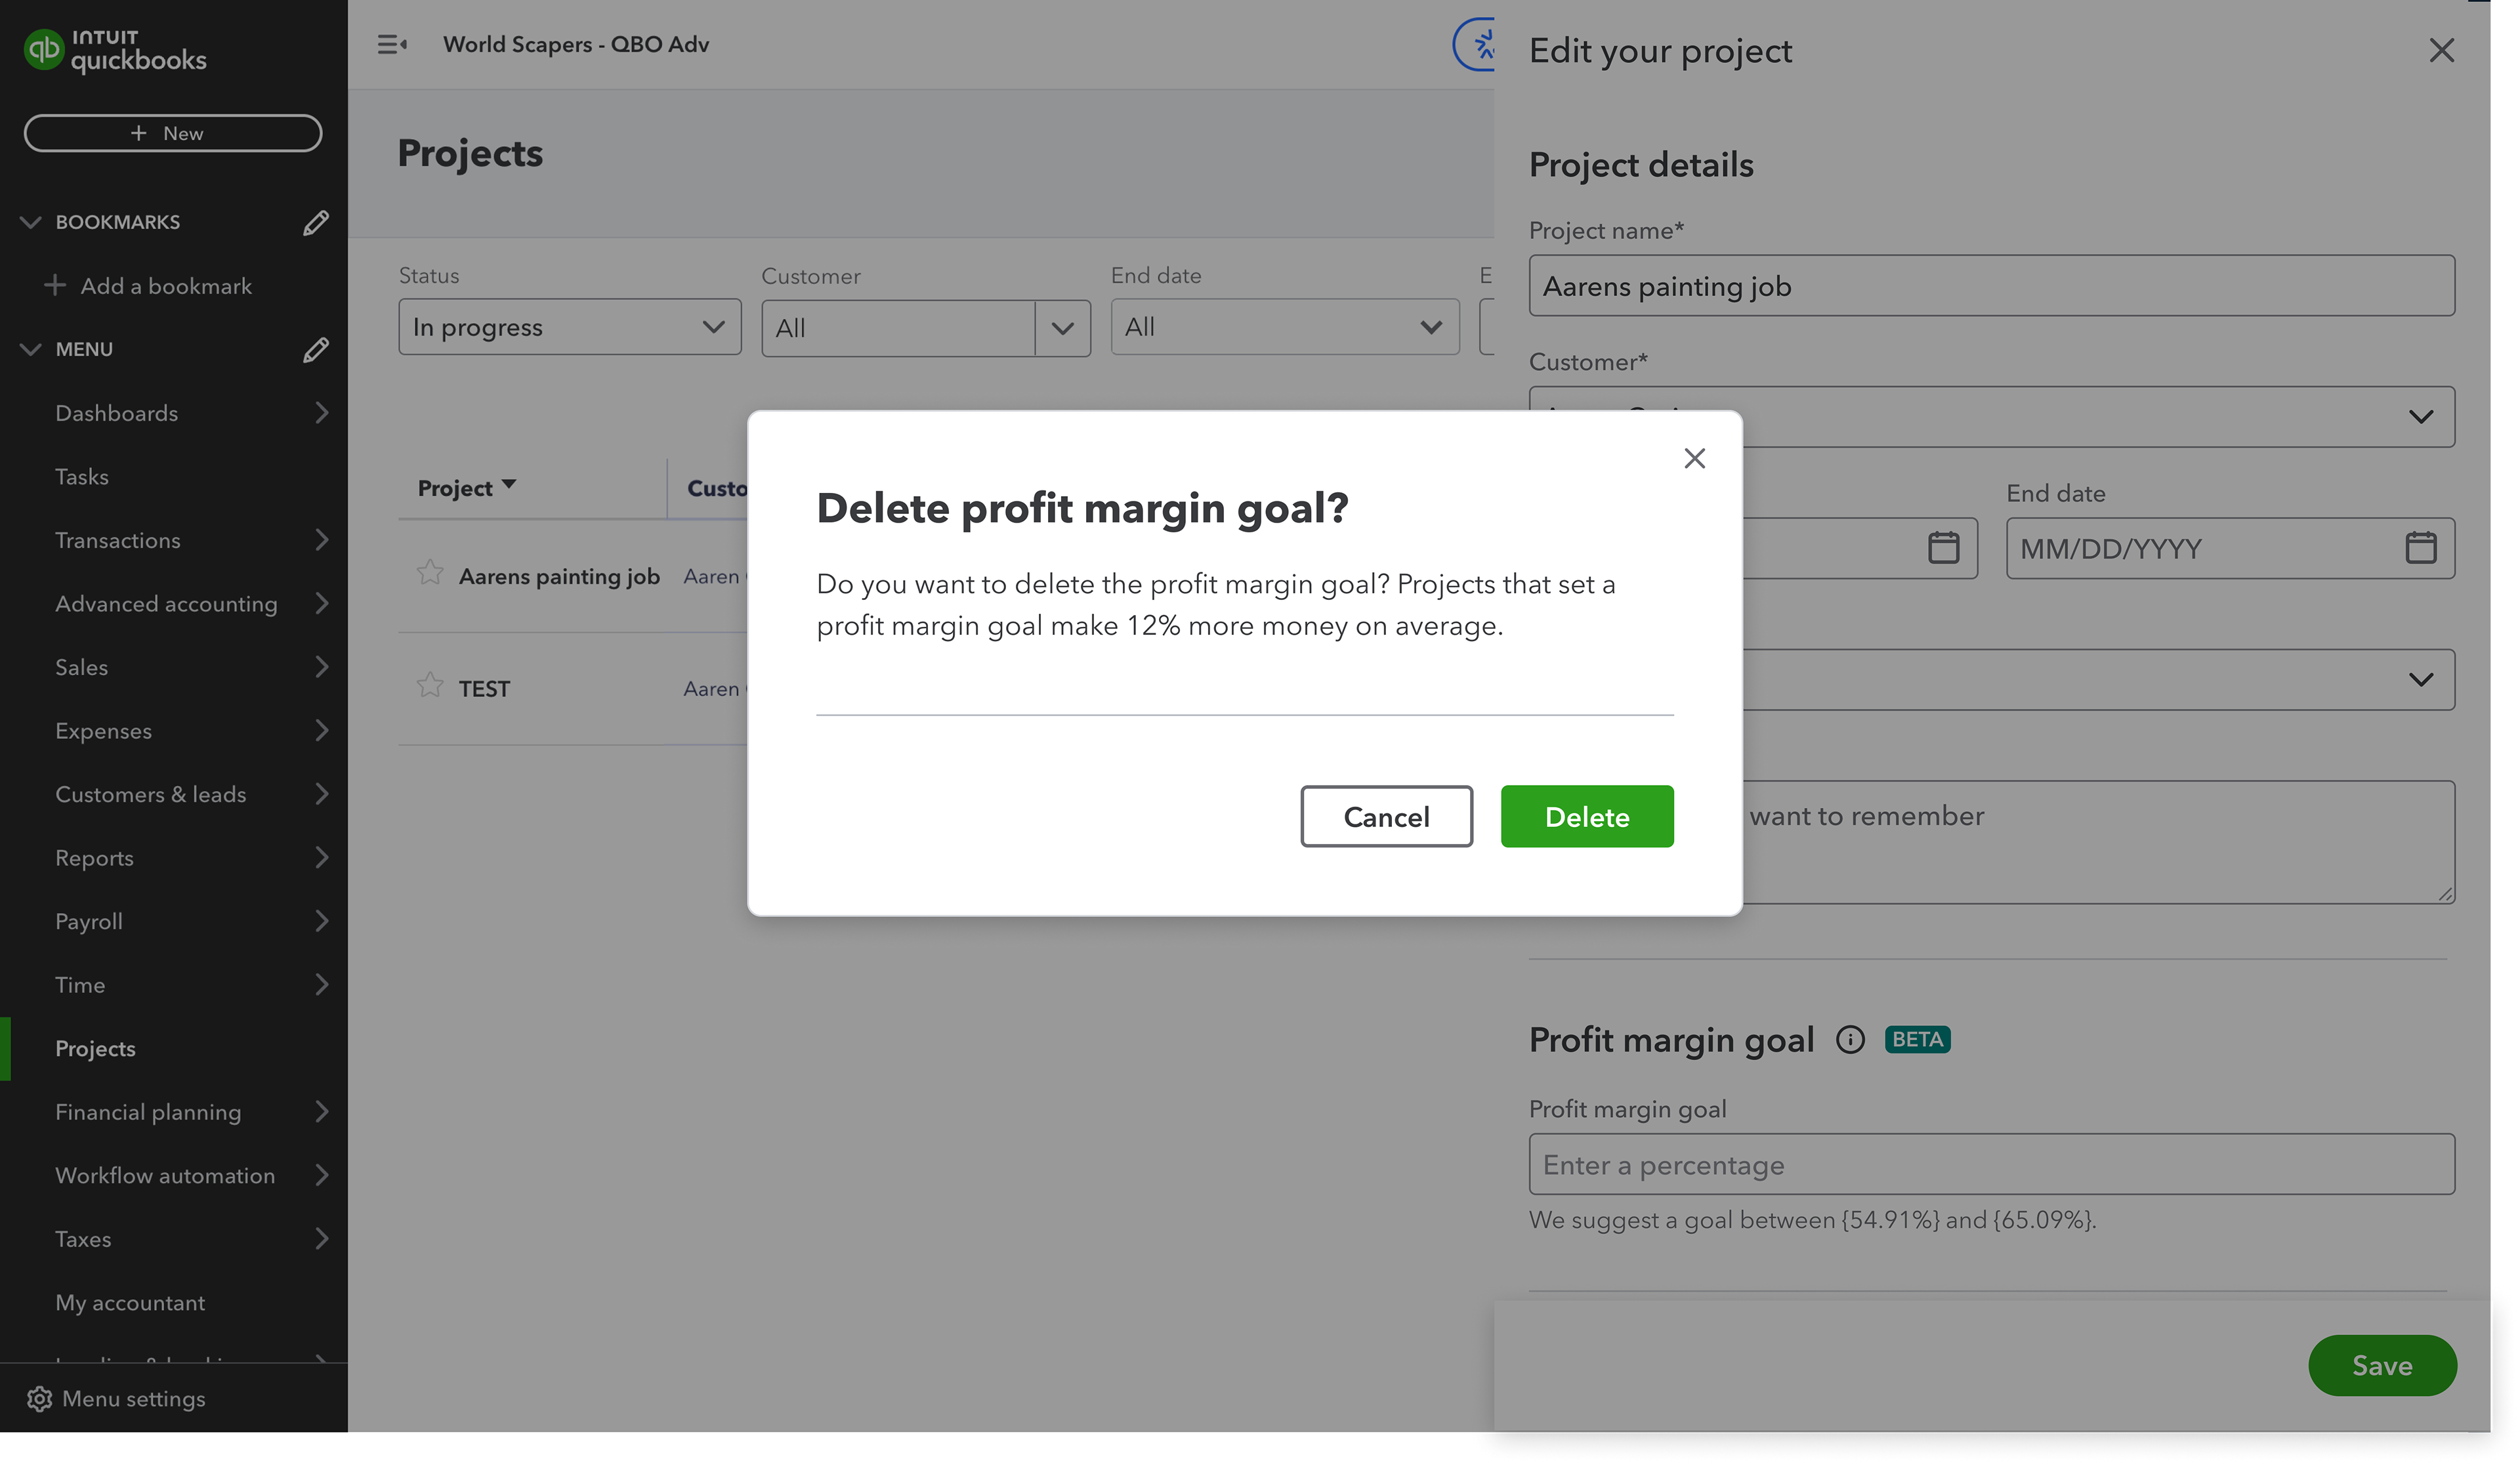
Delete goal
When customers attempt to delete the goal, a double-confirmation modal appears to confirm their intent and prevent accidental deletion.
I Step 2
⚠️ The project goal is at risk/off-track
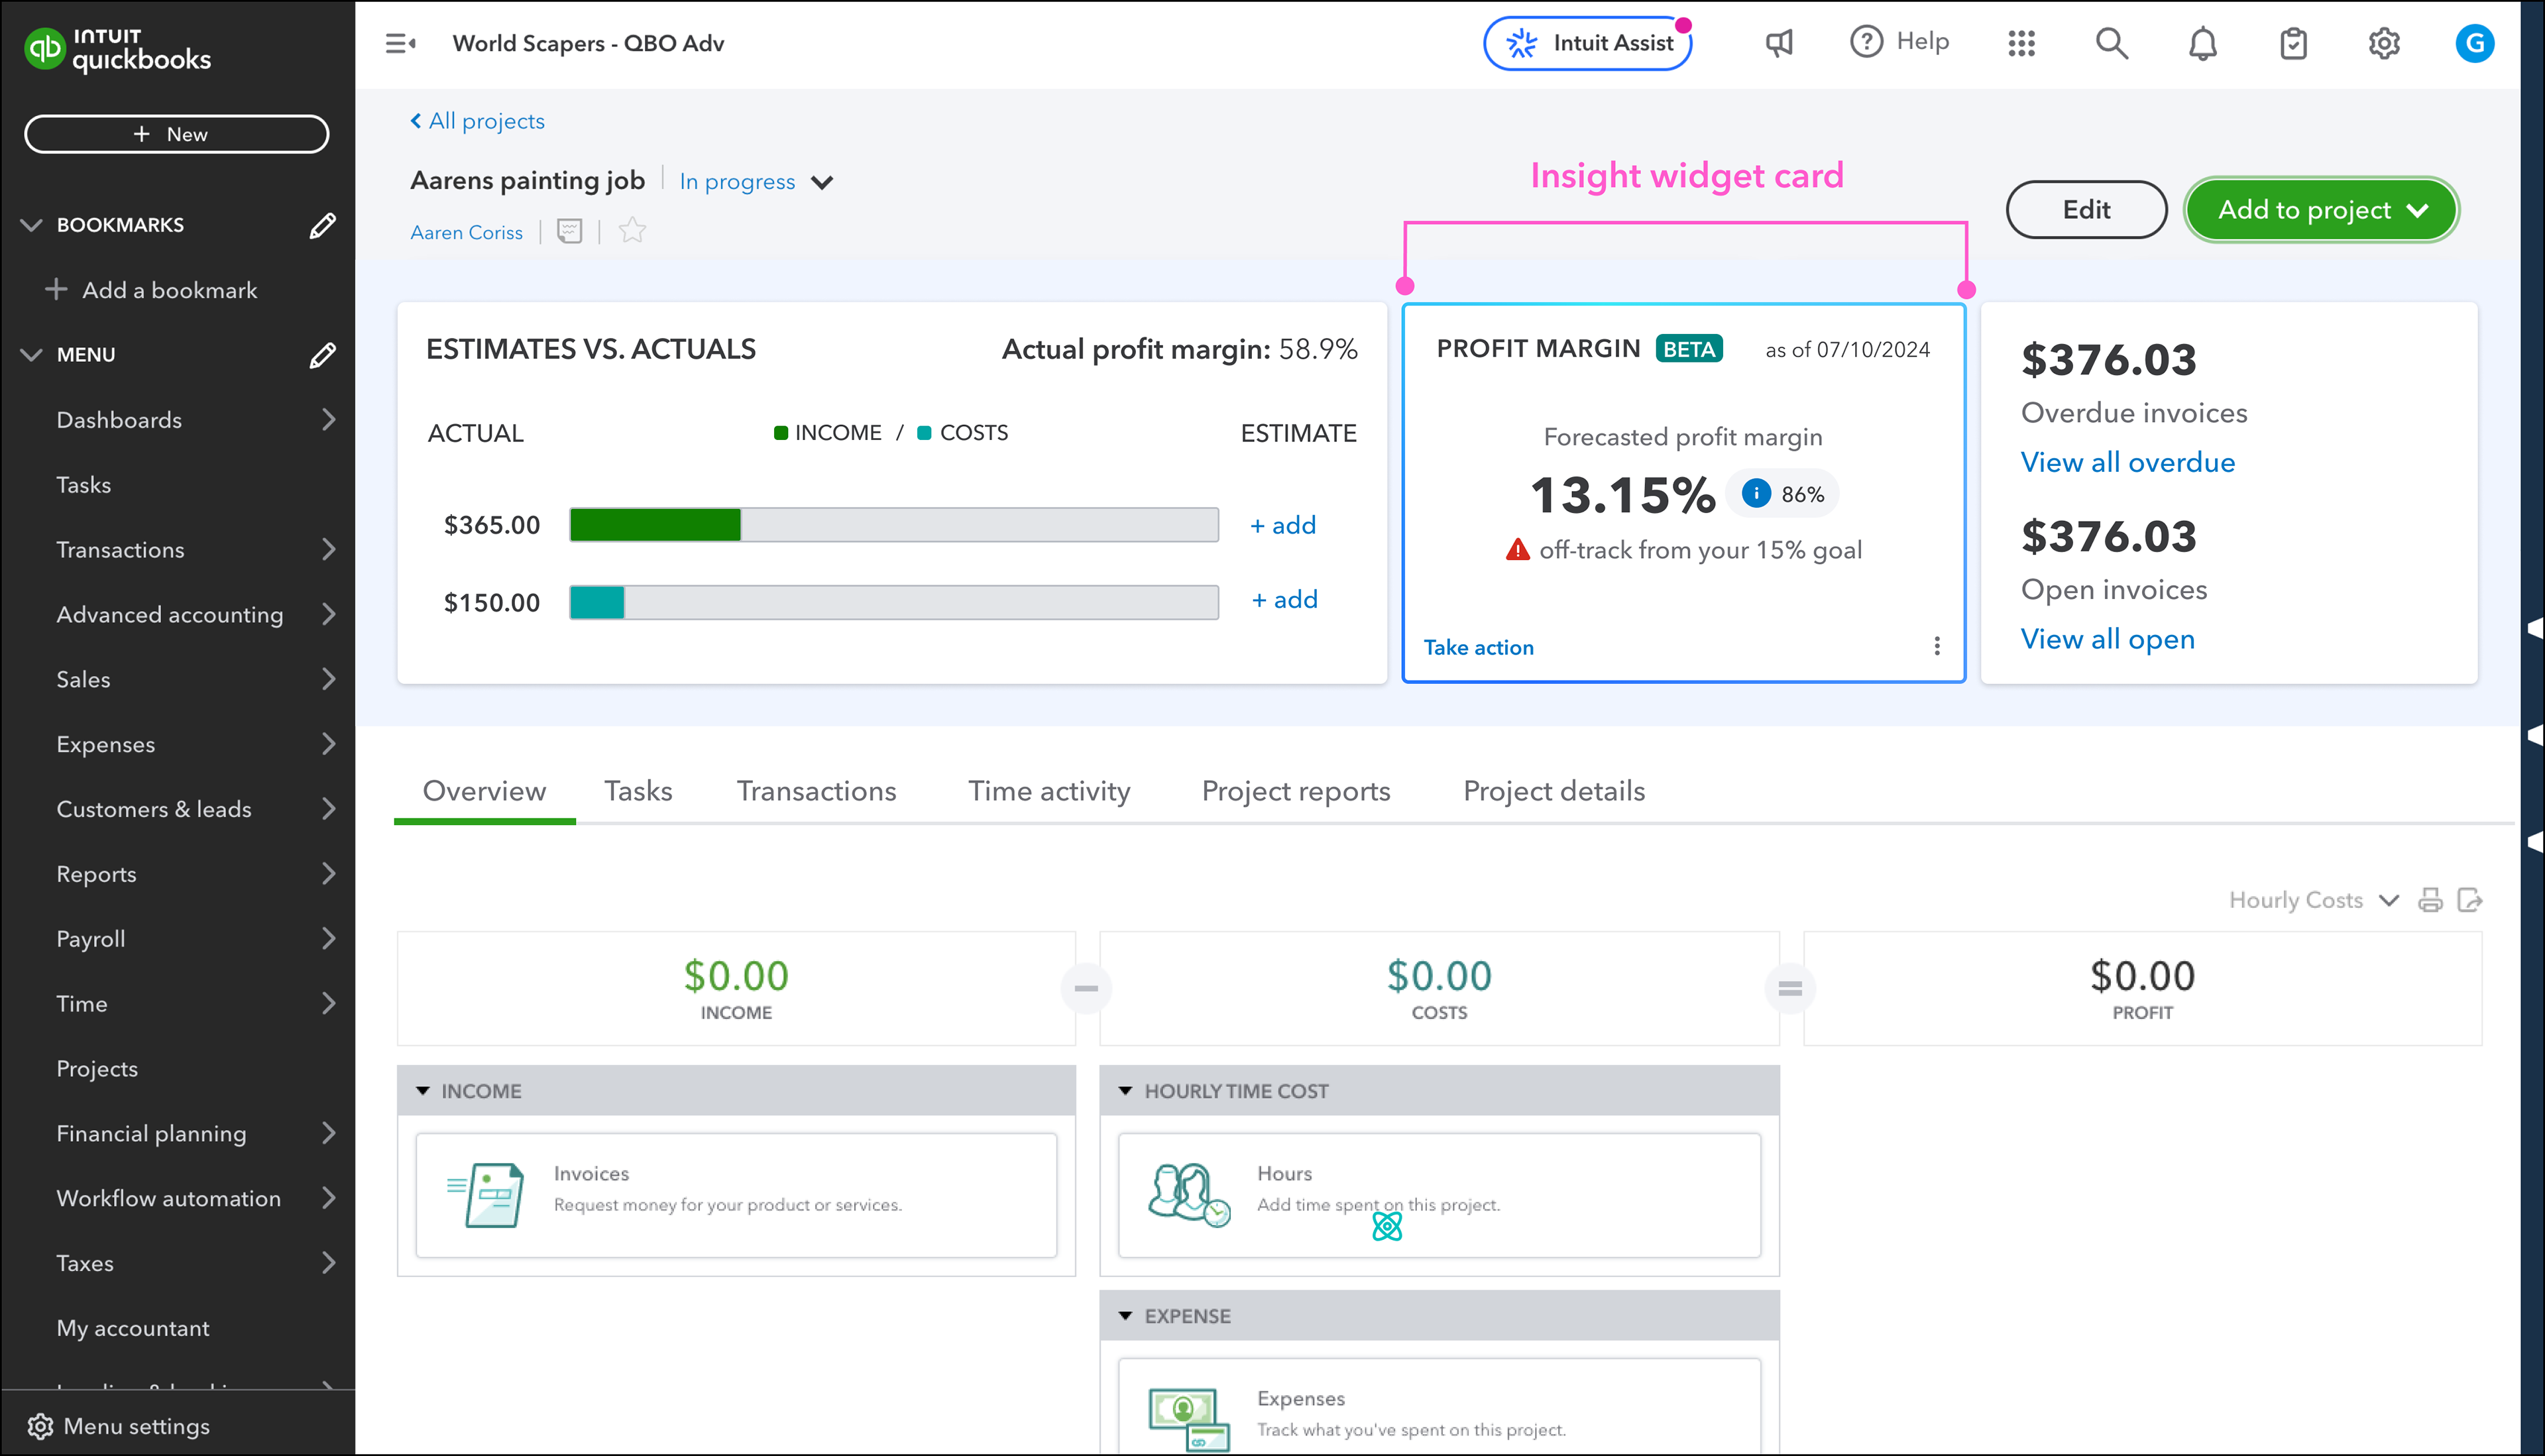
The insight widget plays a key role in Project Profitability. It serves as the entry point for customers to set profit margin goals and take actionable steps when the project is at risk/off-track. It also enables users to track and monitor profitability directly within the widget.
Insight Widget Design
When I collaborated with the UXR team and released the prototype to 50 customers, the engagement rate of the insight widget to set a goal was lower than expected.
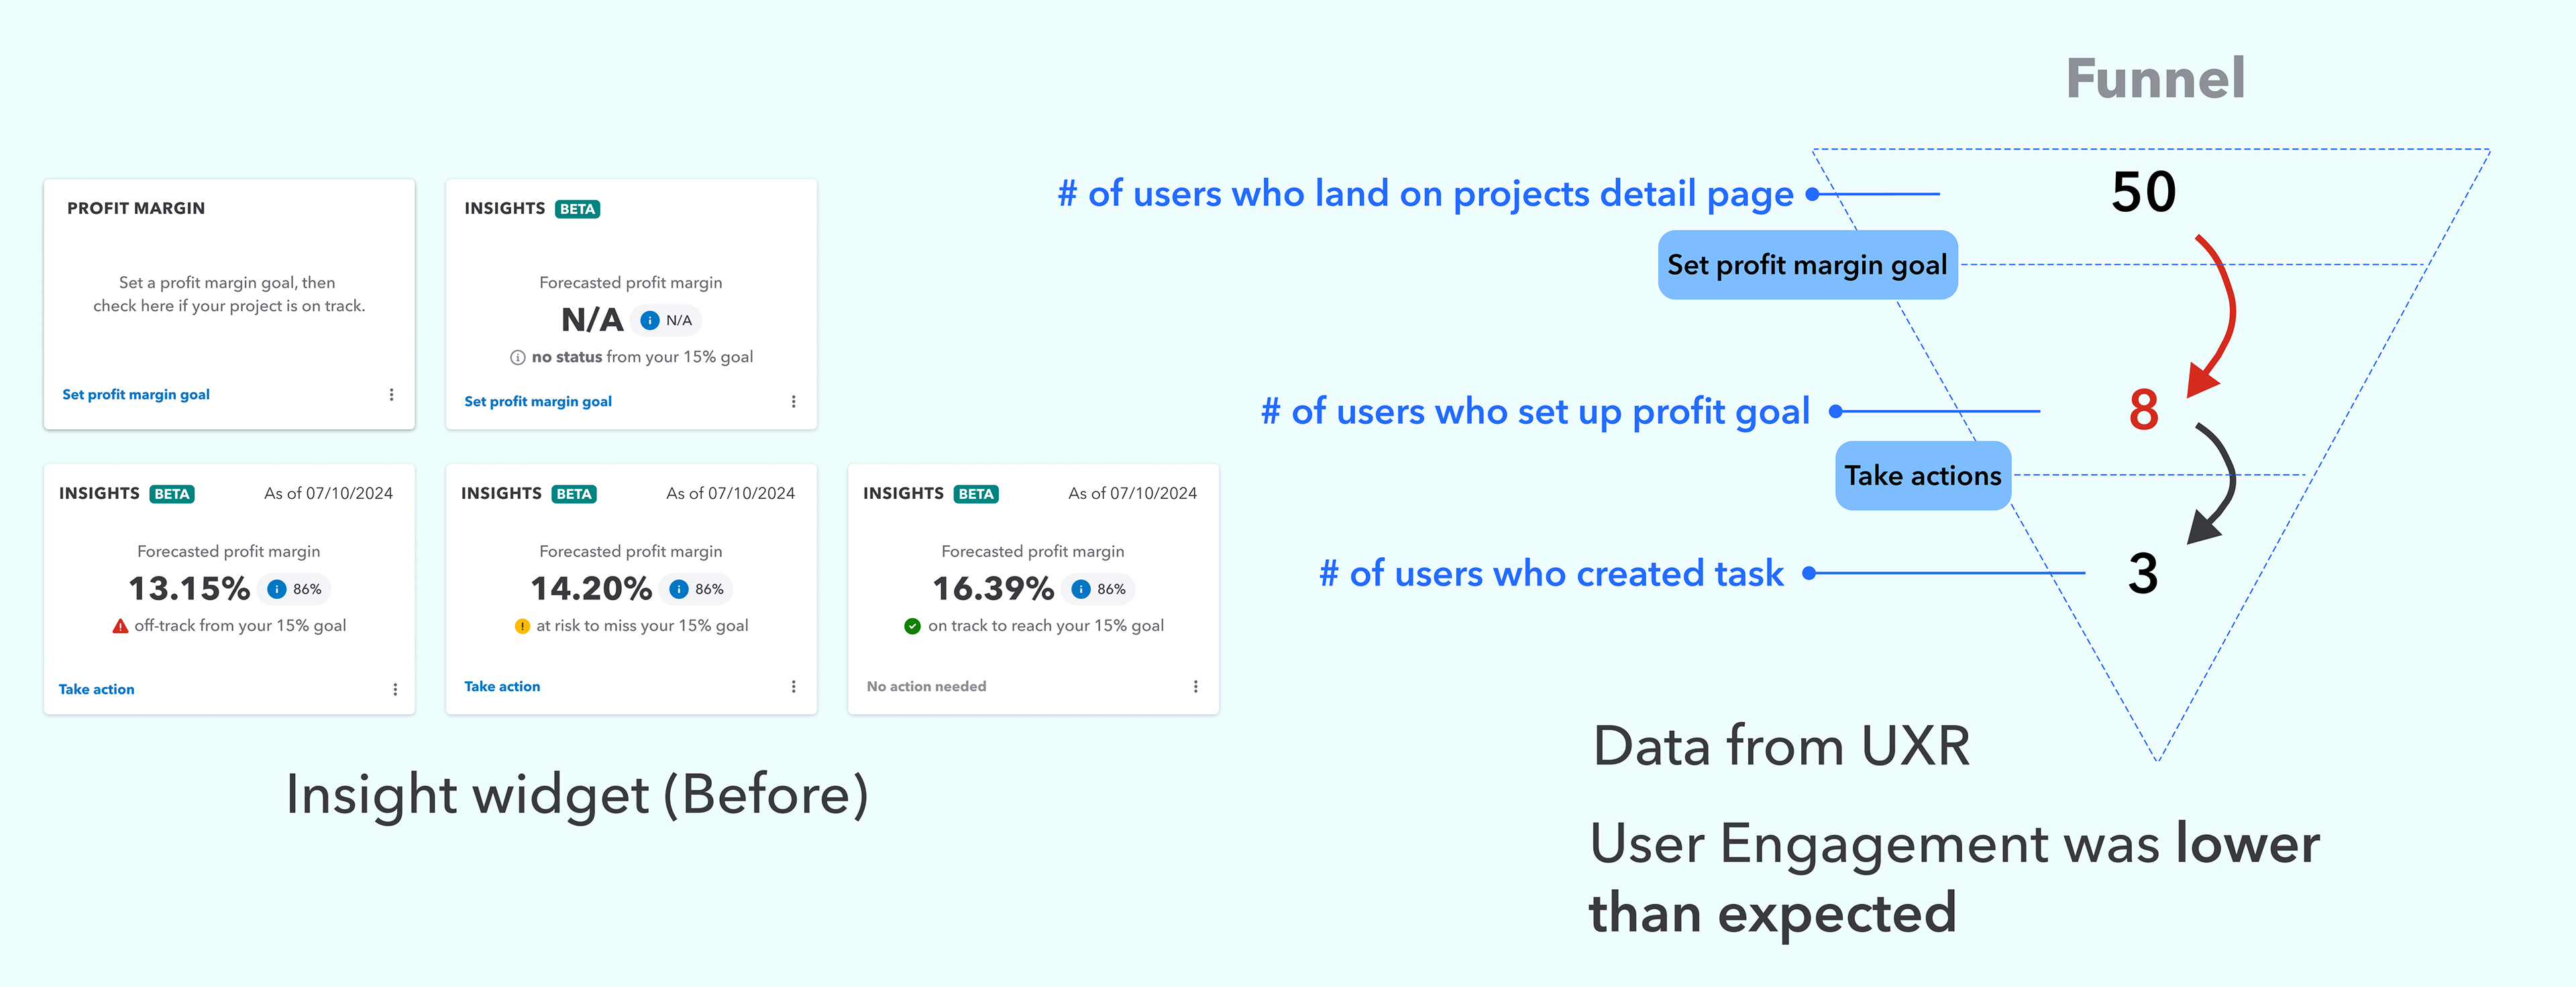
So, to drive engagement and increase the prominence of the action, we redesigned the insight widget by changing the CTA link to a button and adding visuals.
No goal
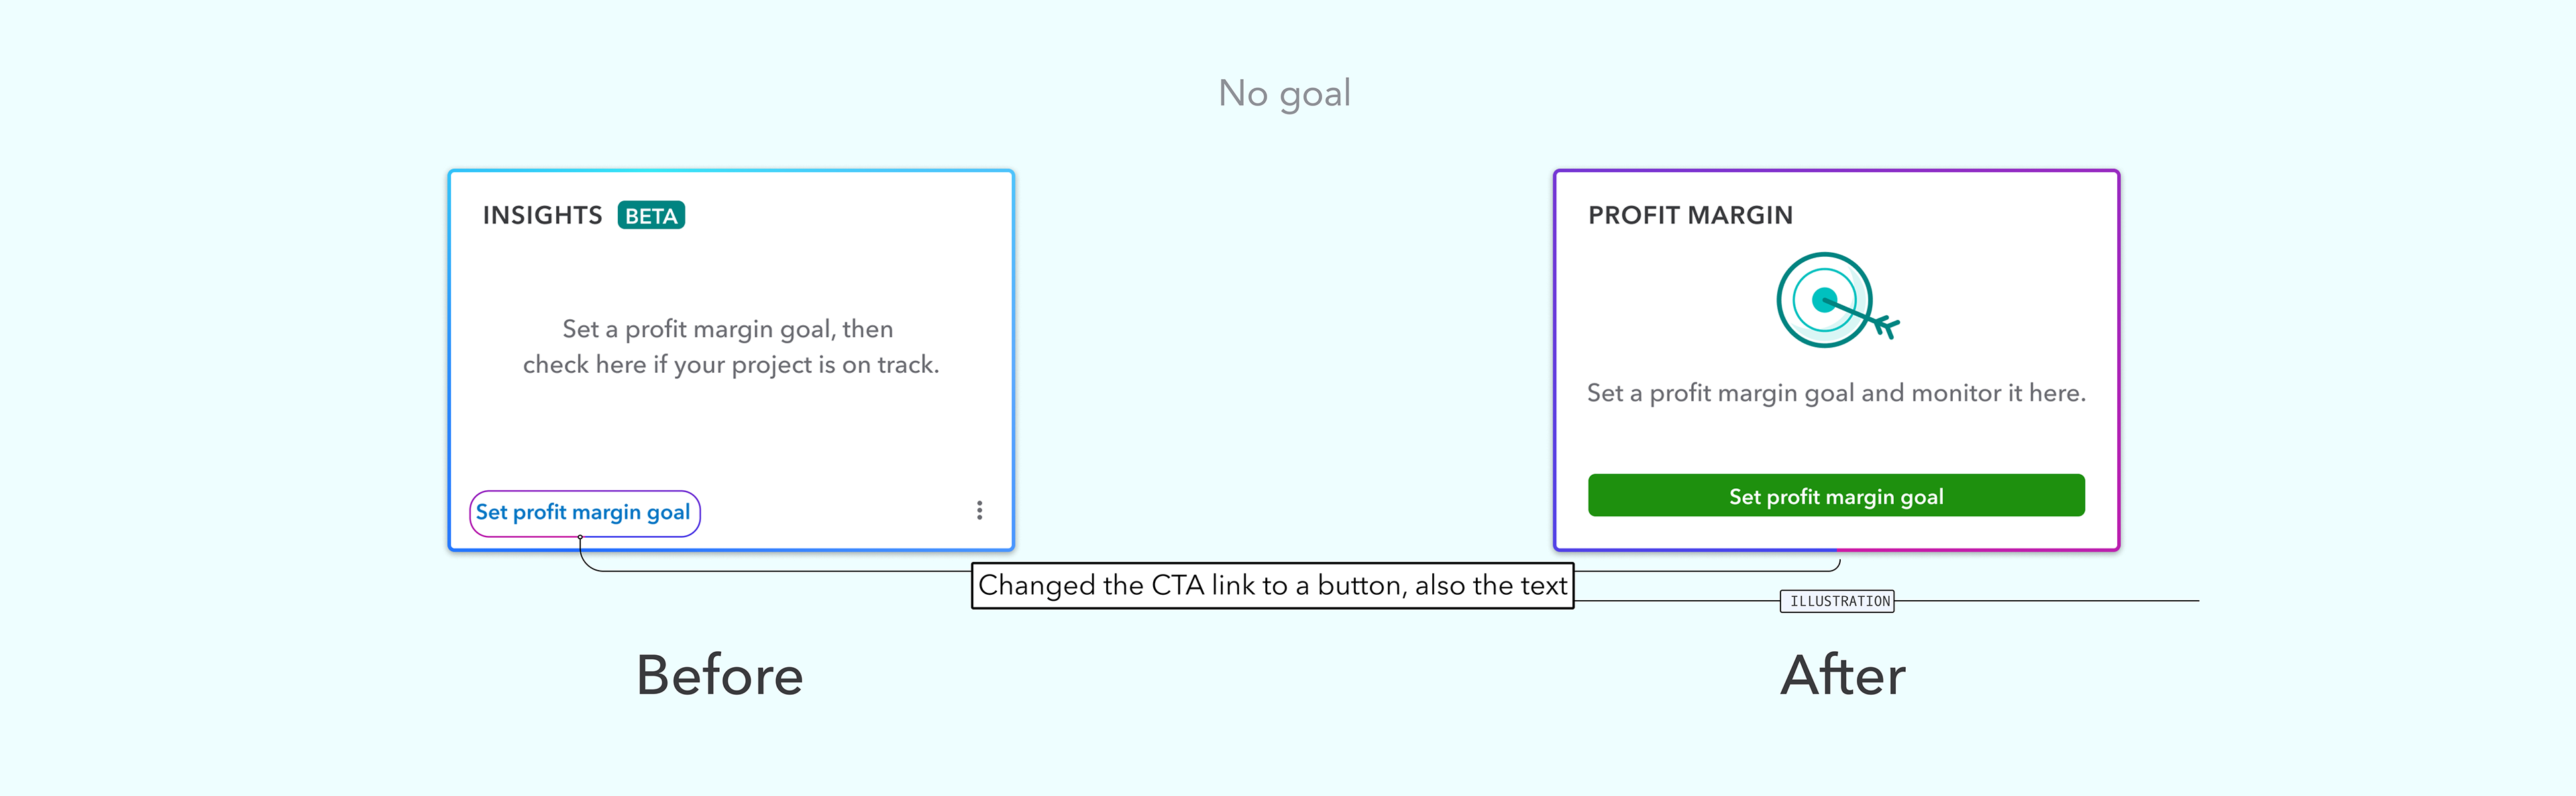
On the no goal insight widget, I changed the CTA link to a button to increase prominence. Then we added the utility icon to the insight widget to help customers discover it easily.
Waiting for data
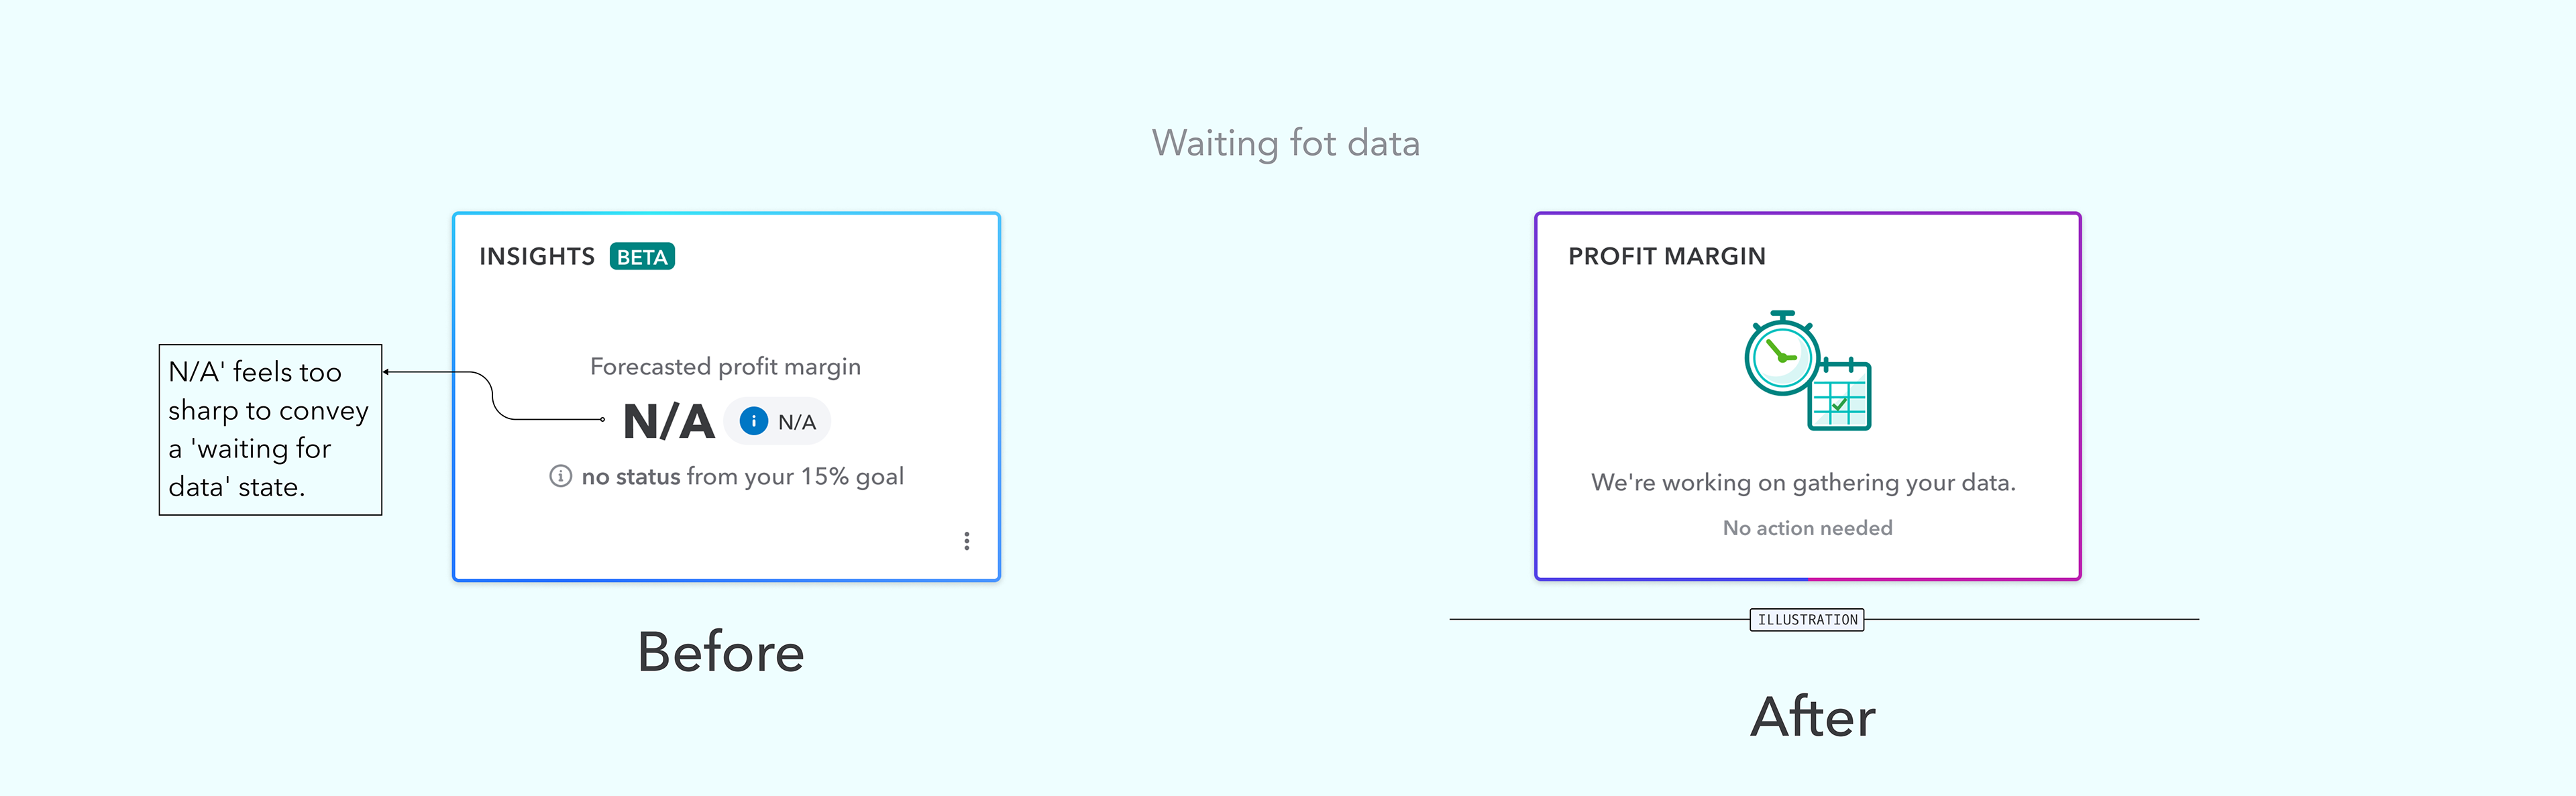
After users add the transaction data, AI will take some time to work on the forecasted profit margin data. So I added another utility icon on the insight widget and a text indicates that we're working on the forcasted data.
Off-track
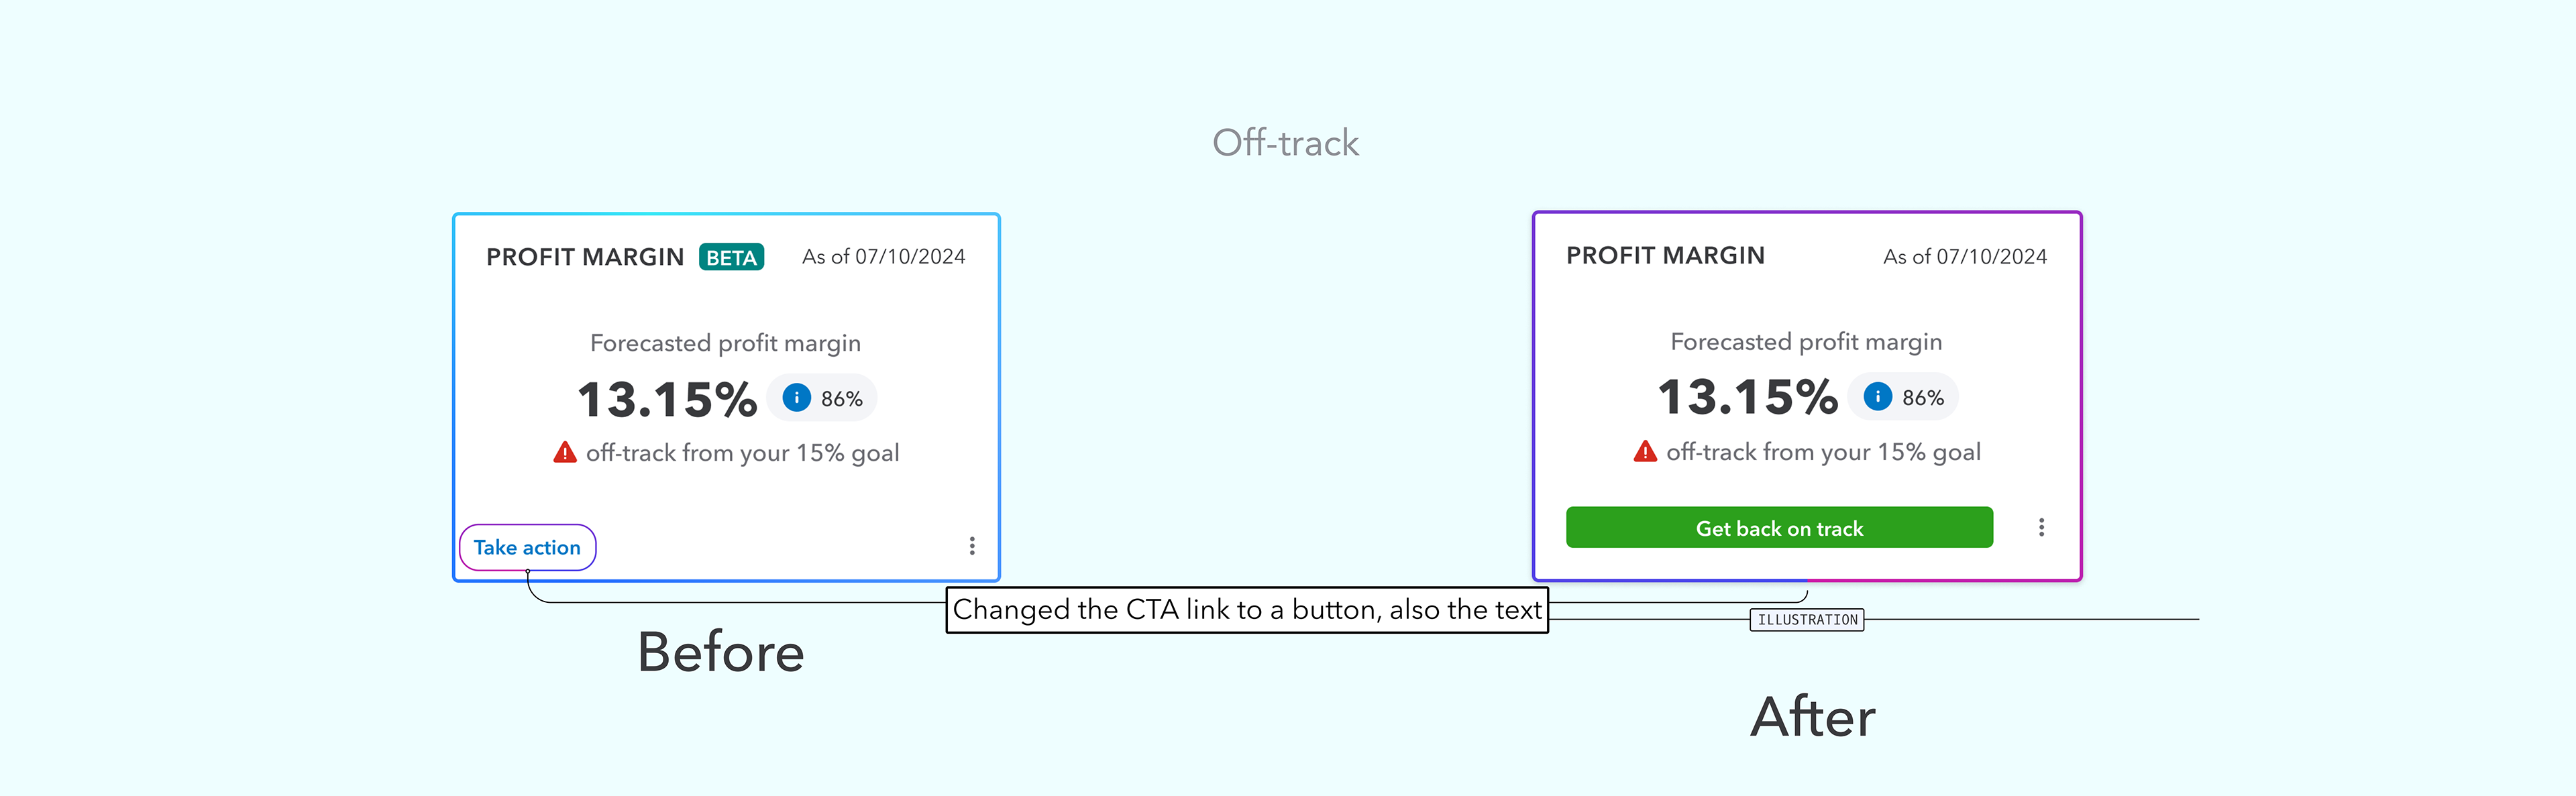
I also changed the CTA link to a button for the off-track, at-risk, and on-track statuses. Due to the limitations of the large language model, the forecasted profit margin data will surface on a weekly cadence. I added the date in the top right corner to indicate when the data is populated.
Validate the Insight Widget Redesign
During the redesign, I also conducted user research via UserTesting to ensure the redesigned version is easier for Mid-Market users to discover on the Projects detail page. Here are the Mid-Market user quotes:
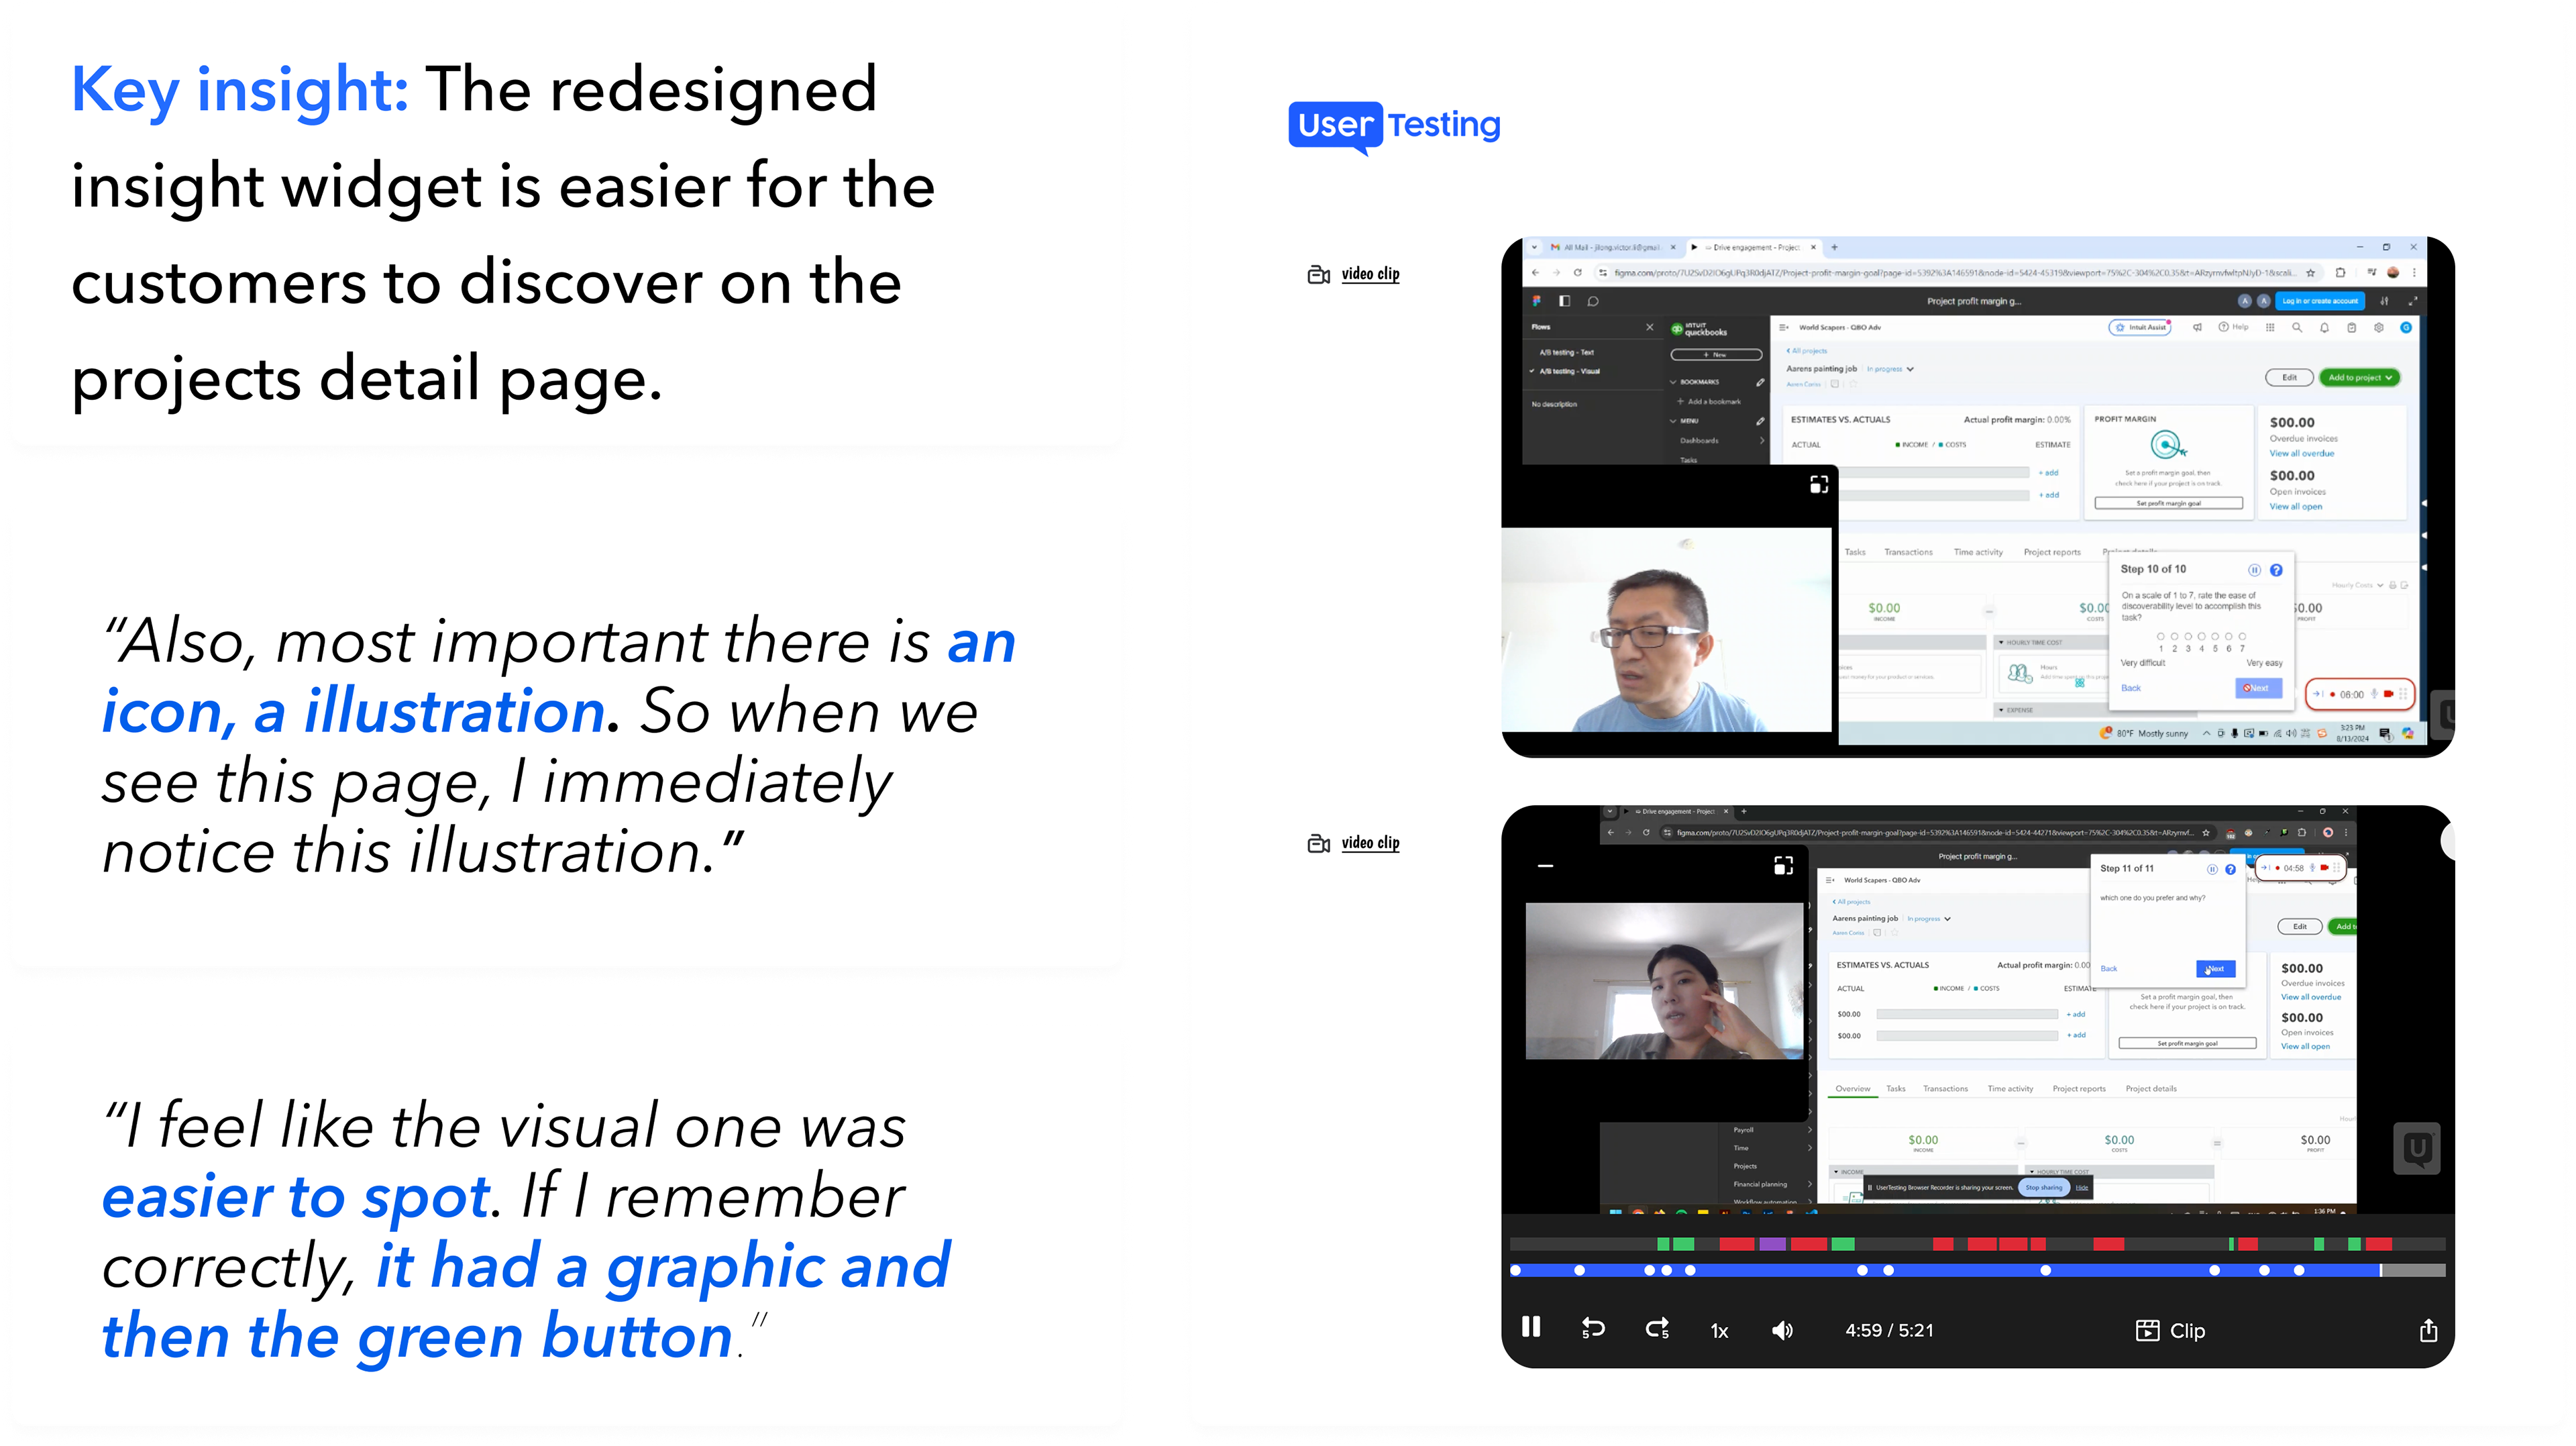
Result from UserTesting
Key insight: The redesigned version reduced time spent on the task, and the task completion rate is 100%.
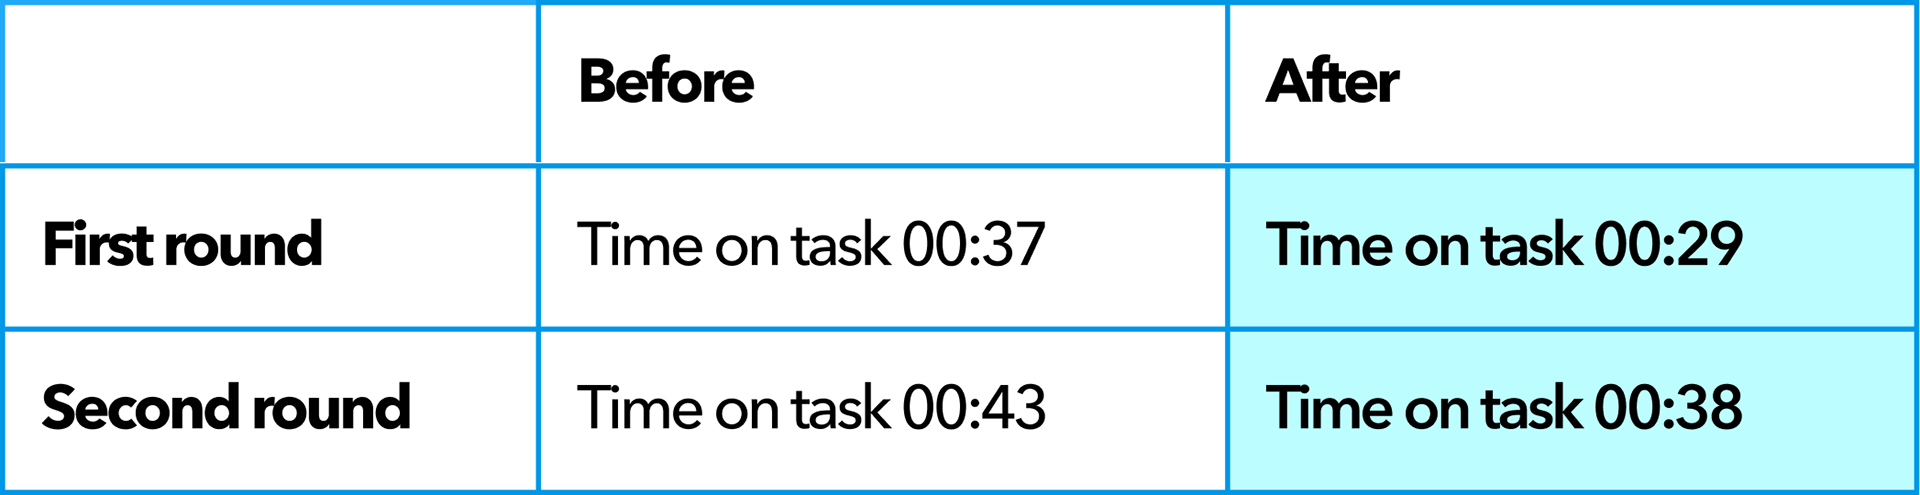
According to the results from the two rounds of usability testing, customers took less time to discover the insight widget when it included visuals in addition to text.
I Step 3
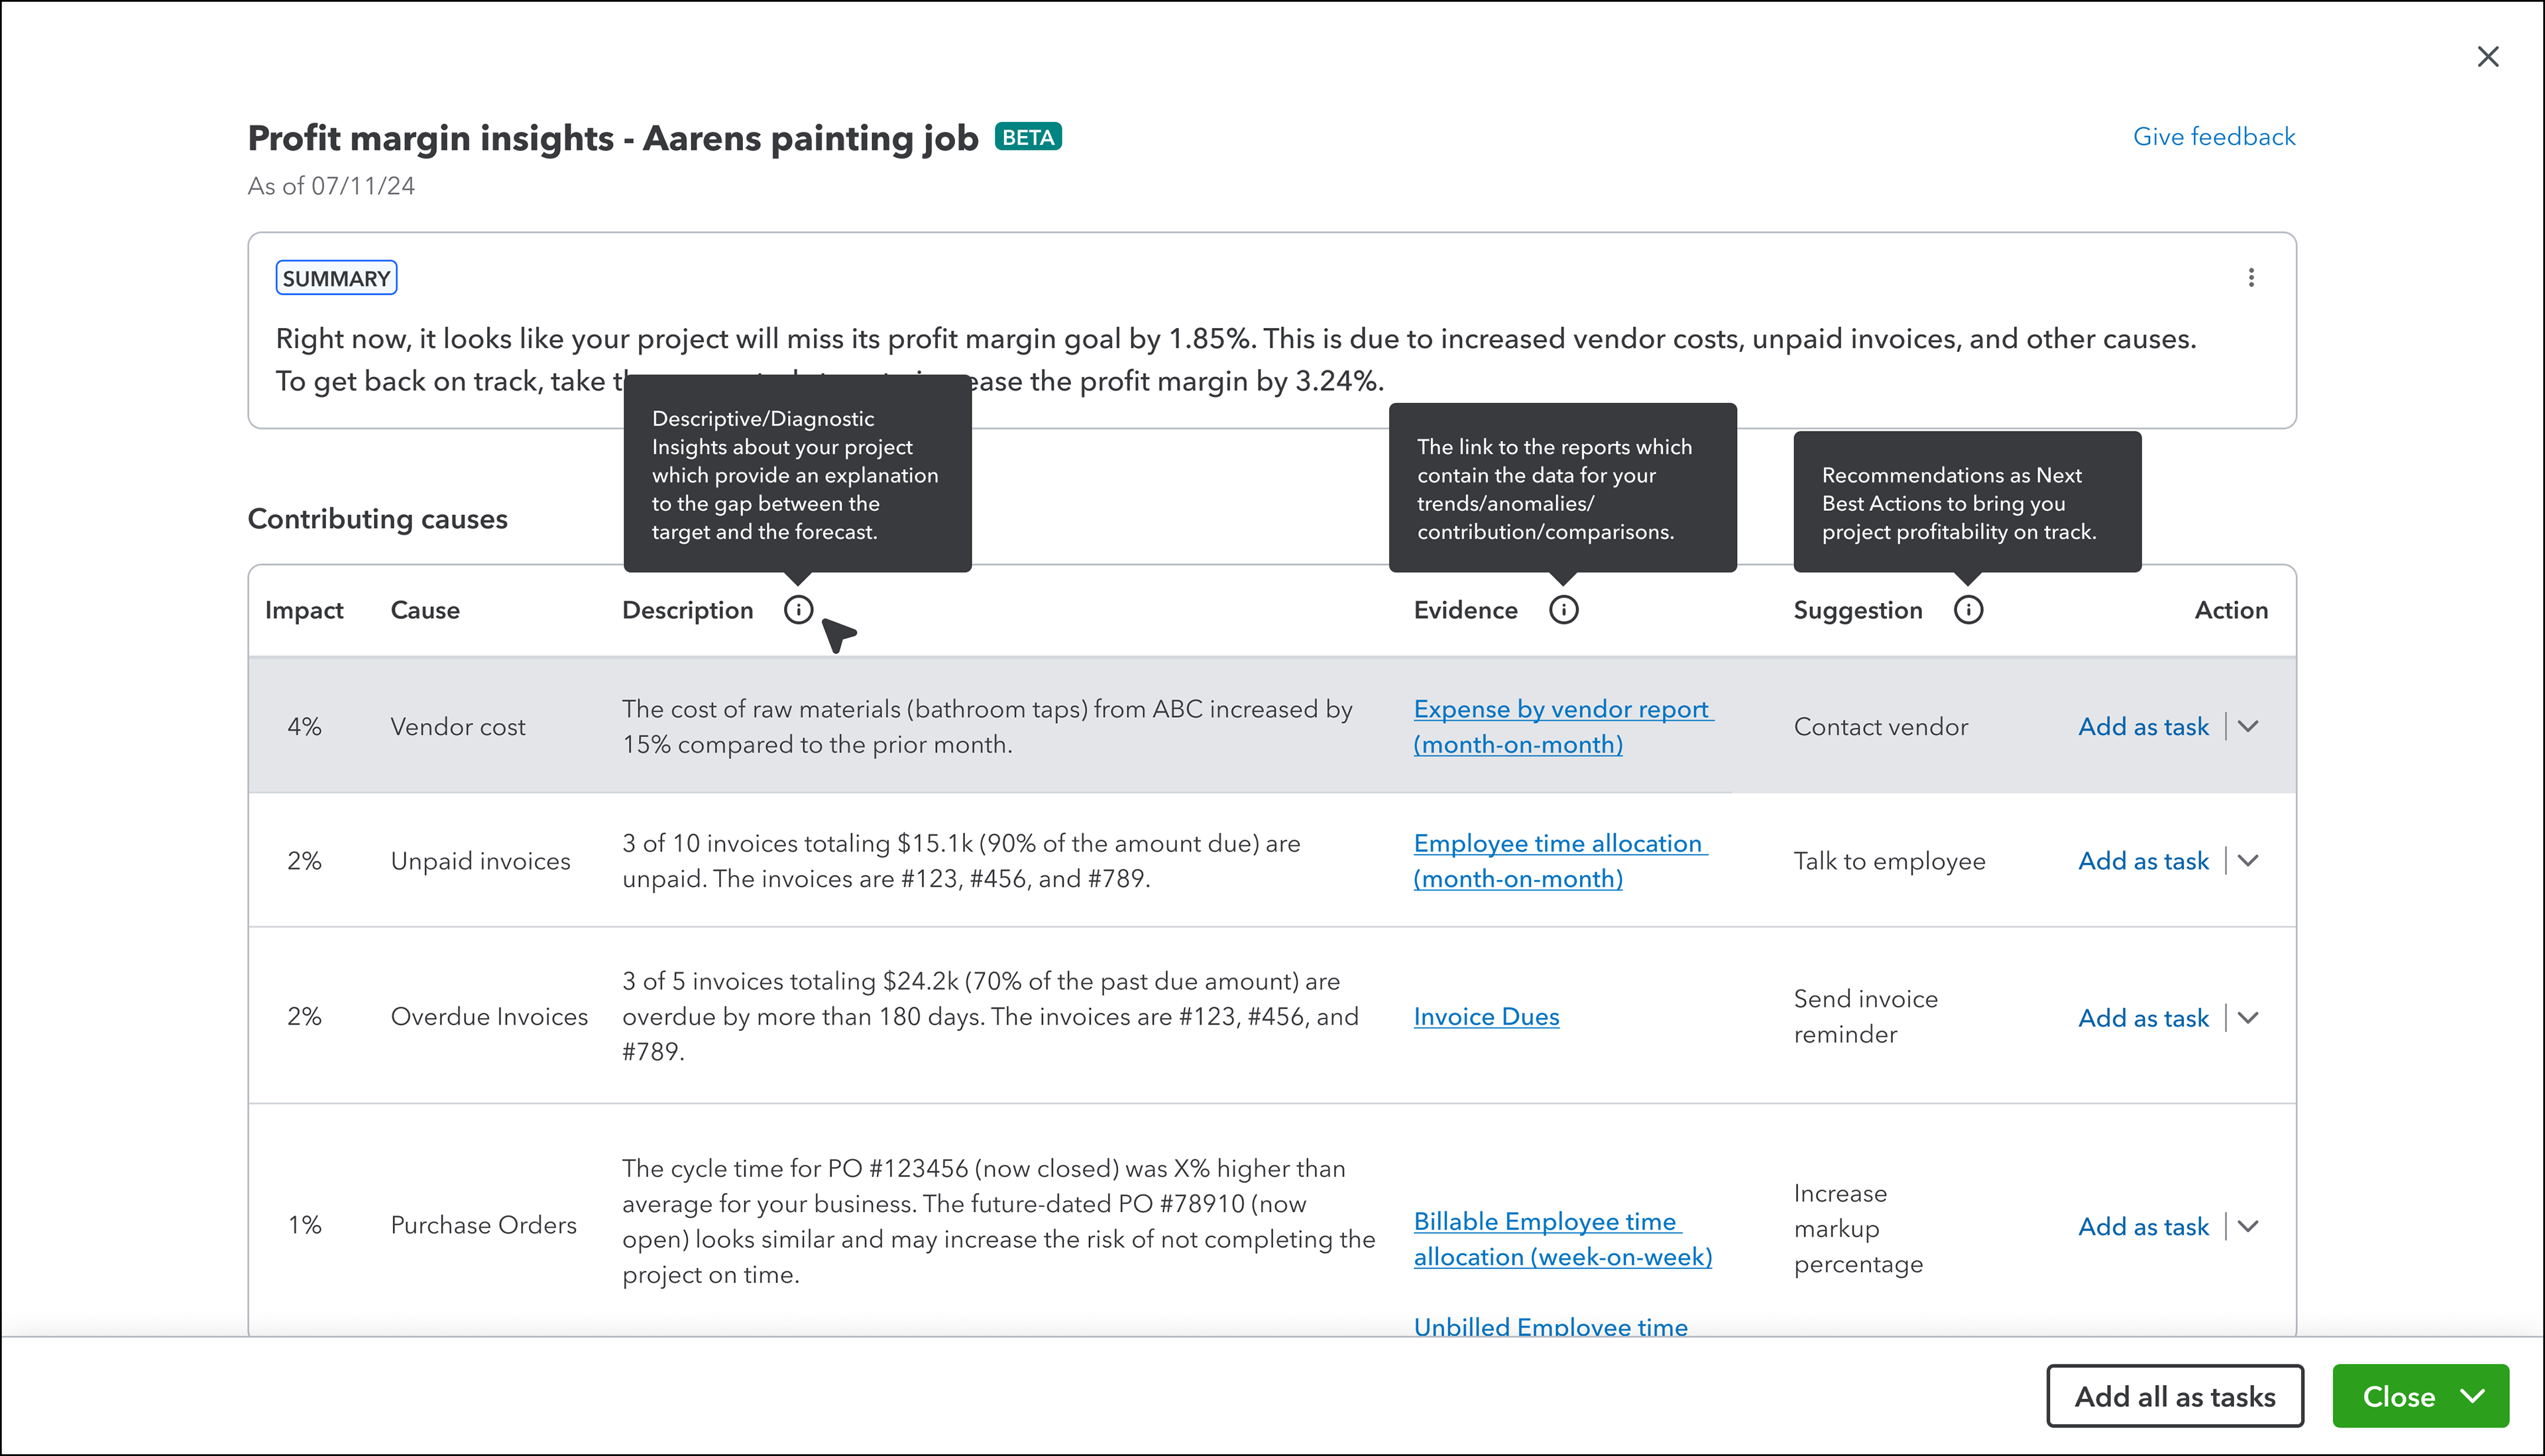
🤔 Find out the causes of at risk/off-track
On the root cause analysis page, customers can see the contributing causes when the project is off-track from the goal. I added a tooltip for each column to help customers better understand each column's purpose.
Root Cause Analysis Feedback Loop
Since this is an AI-powered project, and the biggest problem with AI is that it's prone to hallucination, collecting customer feedback for the root cause could help us better train the large language models to increase the accuracy of AI.
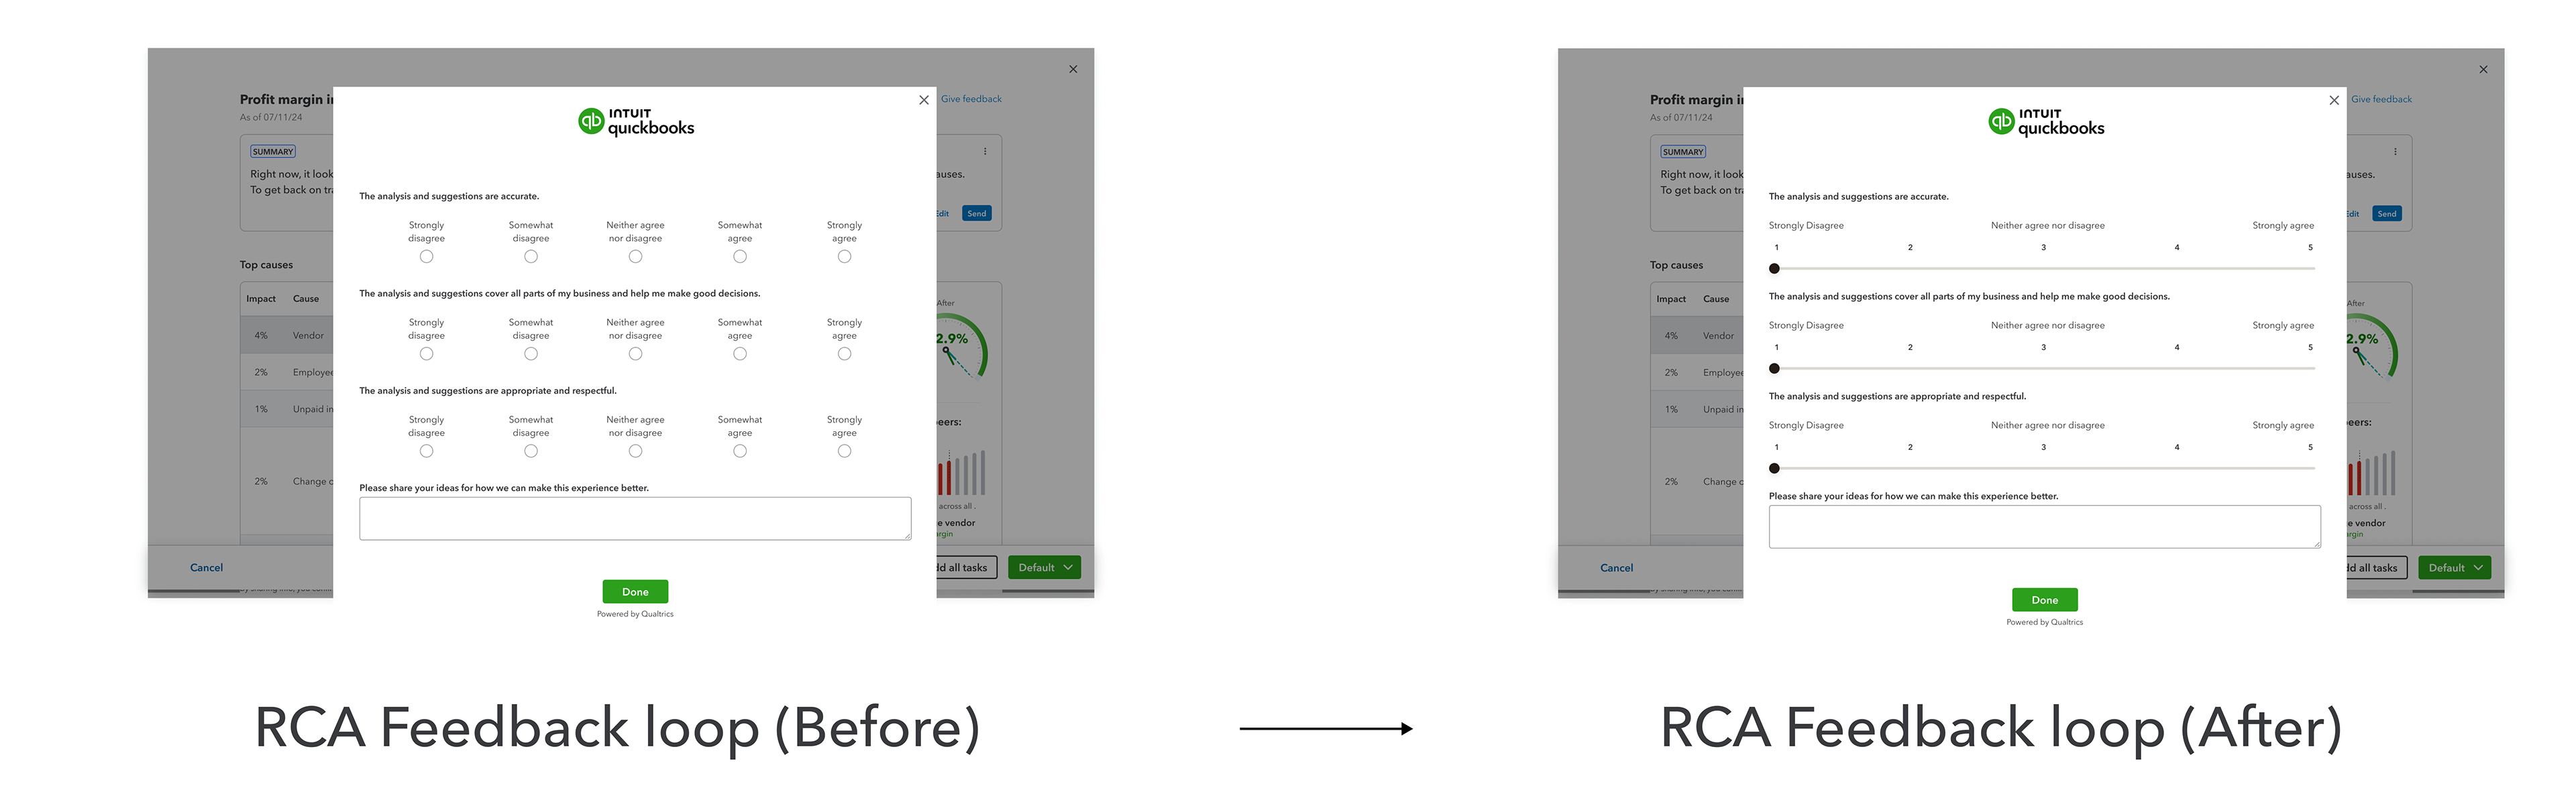
Therefore, I designed a feedback loop survey to collect customer feedback on each root cause analysis (RCA) line item to improve model training. We used a third-party platform, Qualtrics, to host the root cause analysis survey. However, since Qualtrics does not support five radio buttons under each question, I designed an alternative solution using a slider. This solution was well-received by the engineers after I handed it off to them.
Launched Version: Figma prototype
Then my team incorporated the new insight widget into the Figma prototype, at that time we got visual support so the left nav was different than the first version.
Next Step Exploration
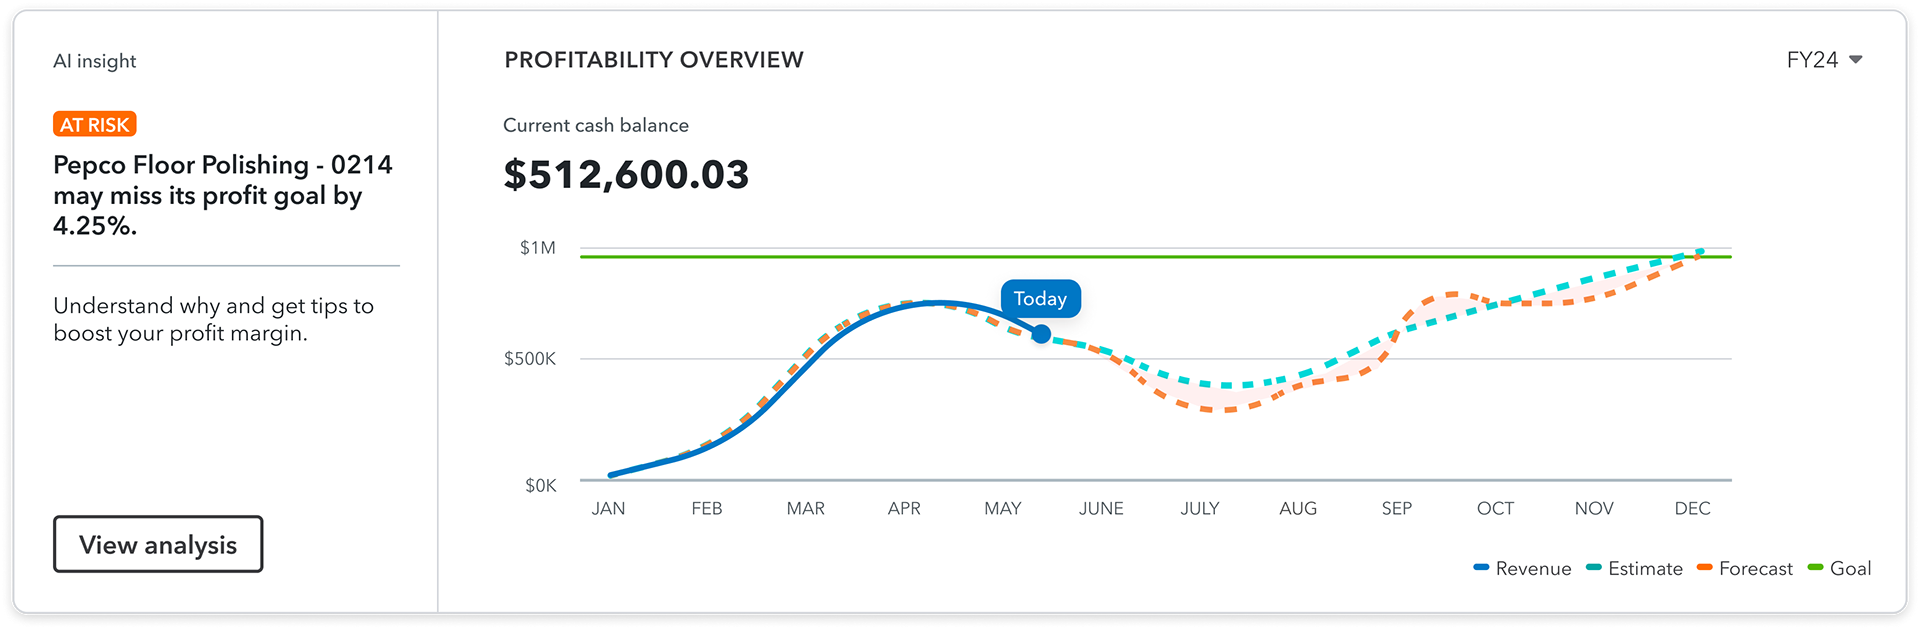
For future use, I designed an insight widget card that contains data viz to better present the profitability. This line chart serves as supporting evidence for the text insight, helping Mid-market customers make quicker decisions.
Impact

The redesigned insights widget improved user engagement and helped users track profitability more easily. It was adopted across multiple teams for consistent scalability, and the project helped the company achieve its goal of supporting Mid-Market business owners in managing their finances effectively.
Reflection
1. Think end-to-end: It's critical to think end-to-end, think holistically, across the product. Consider the impact of your design and how it will scale in the future.
2. Differences between B2B and B2C: Customers of B2B products usually have a high tolerance for complexity. Unlike B2C products that prioritize hiding complexity with simple interfaces, B2B products often focus on multiple functions and being easily accessible. Therefore, the key is to bring clarity to complexity instead of hiding complexity.